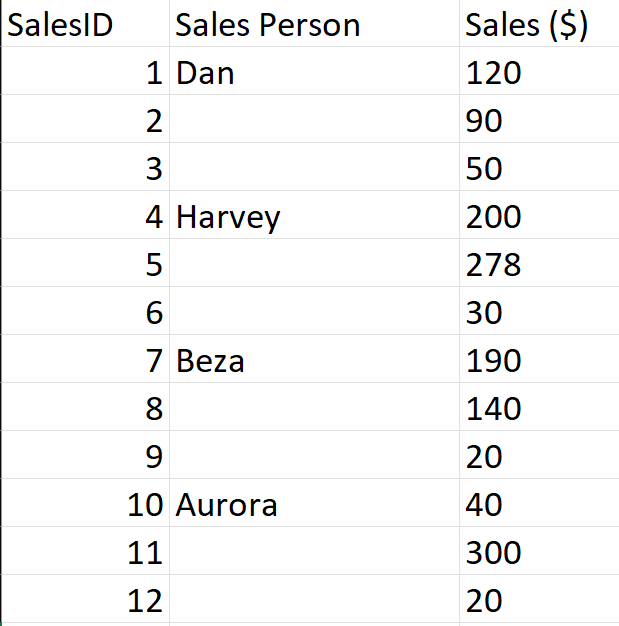
In the latest release of Tableau Prep (2023.3), Tableau have added a highly requested feature called Fill Down. This feature allows you to fill in blanks or null values of data. For example, you are given an Excel spreadsheet that contains rows of missing data like below. Whilst this challenge of data prep is not impossible to solve, the workarounds are timely but the instances of this occurring are very common in the real world. therefore, this new feature is a welcome addition.
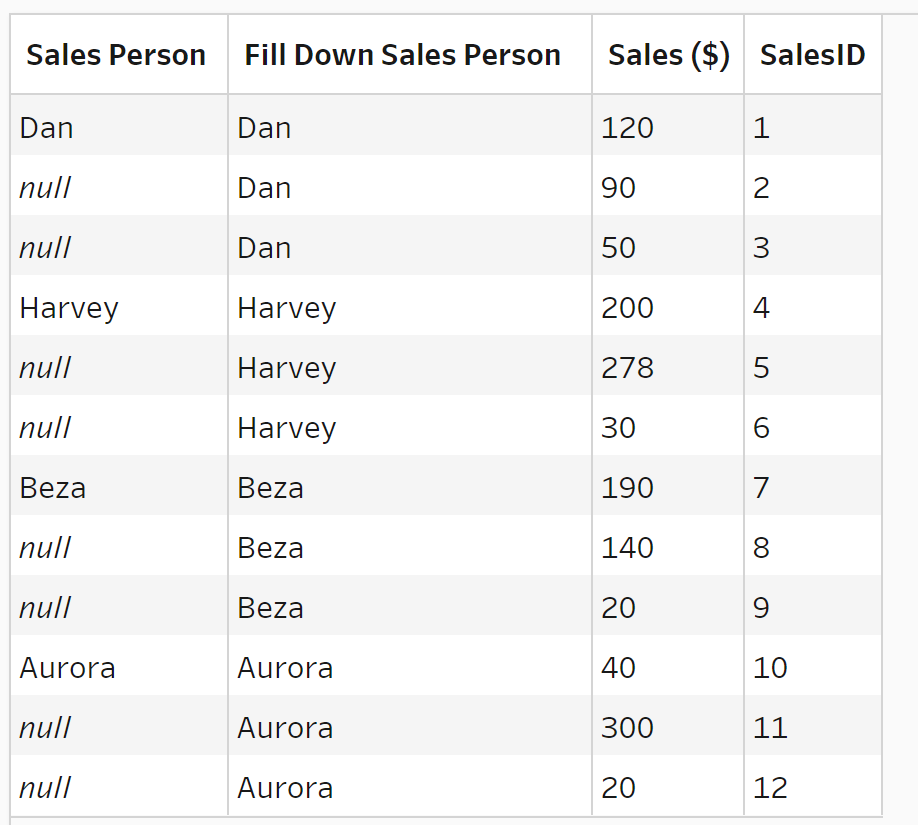
In this scenario our Excel user has left missing rows in our dataset, whilst this is readable in its current state, we would be unable to do additional analysis in this current format. Instead we would like to apply a Sales Person to each row of data.
Step 1
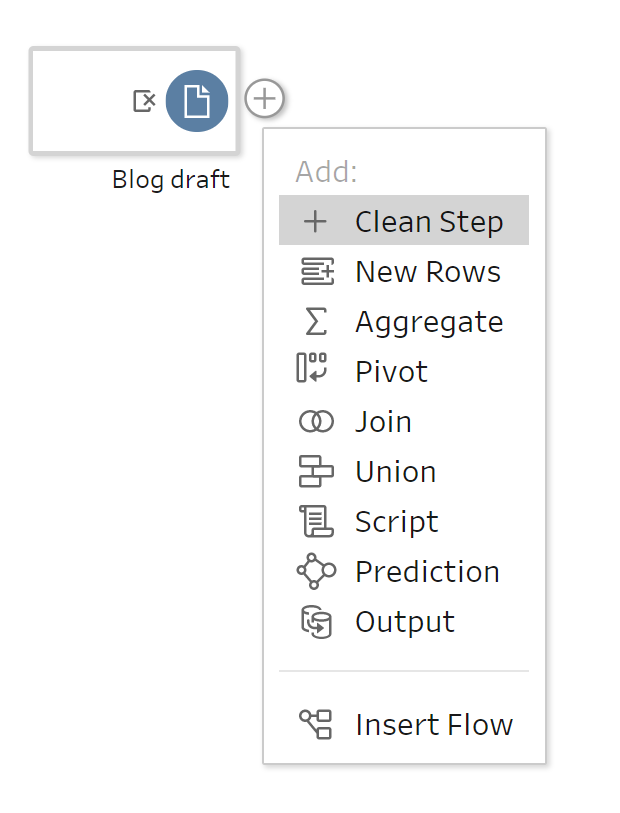
With our data sources loaded in Tableau Prep, we can create a new "Clean Step".
Step 2
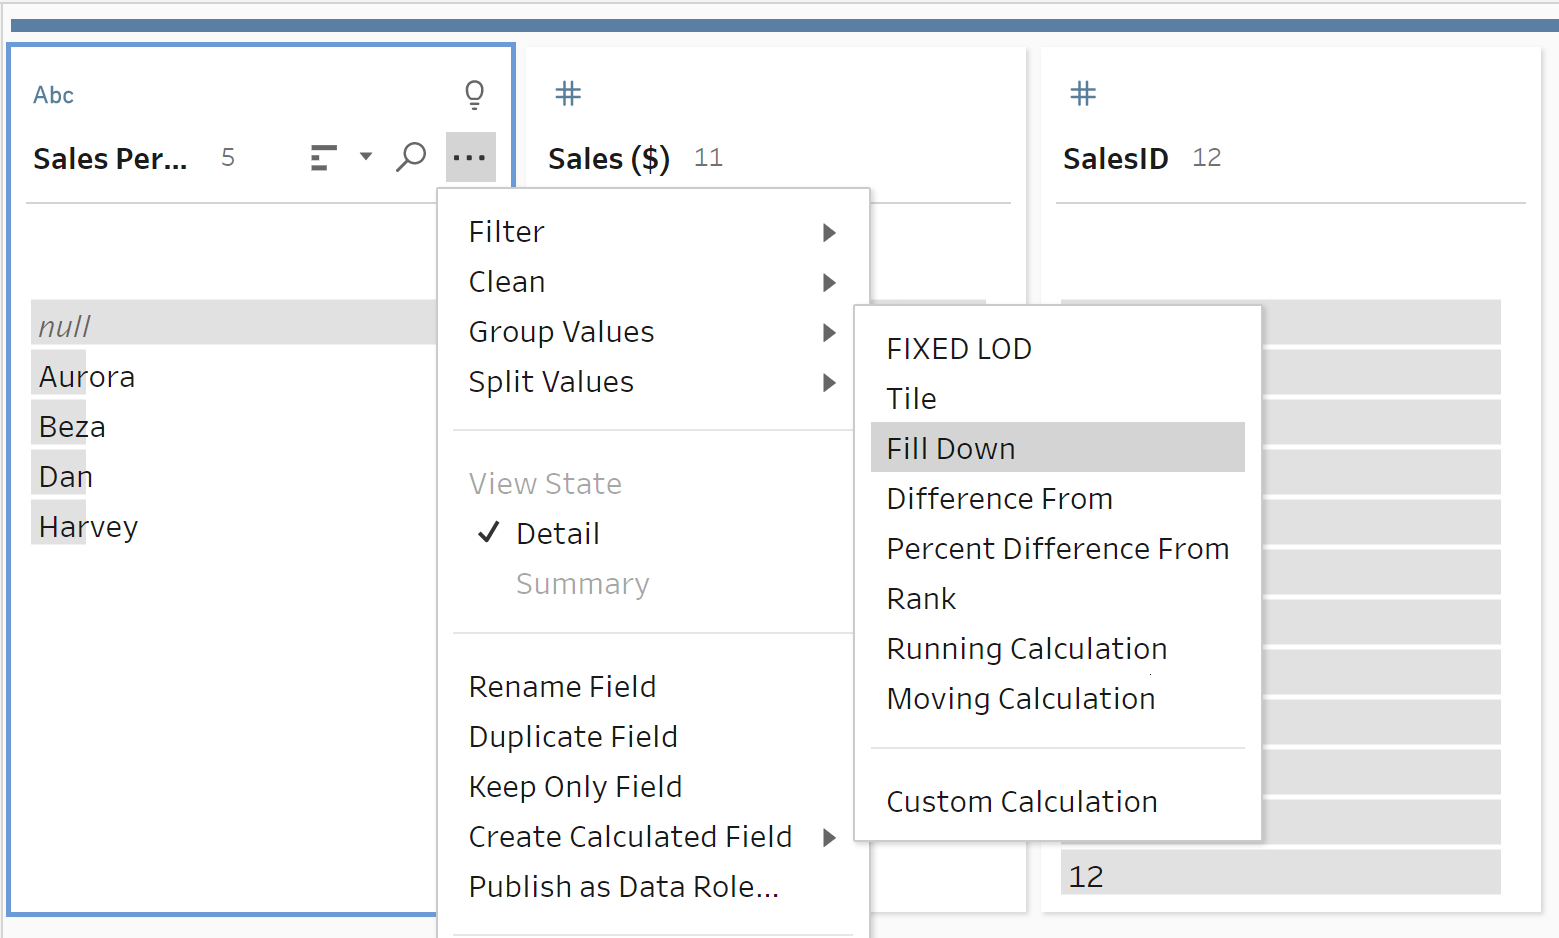
Next, click the three dots on your column header and go to “Create Calculated Field” and then click “Fill Down”.
Step 3
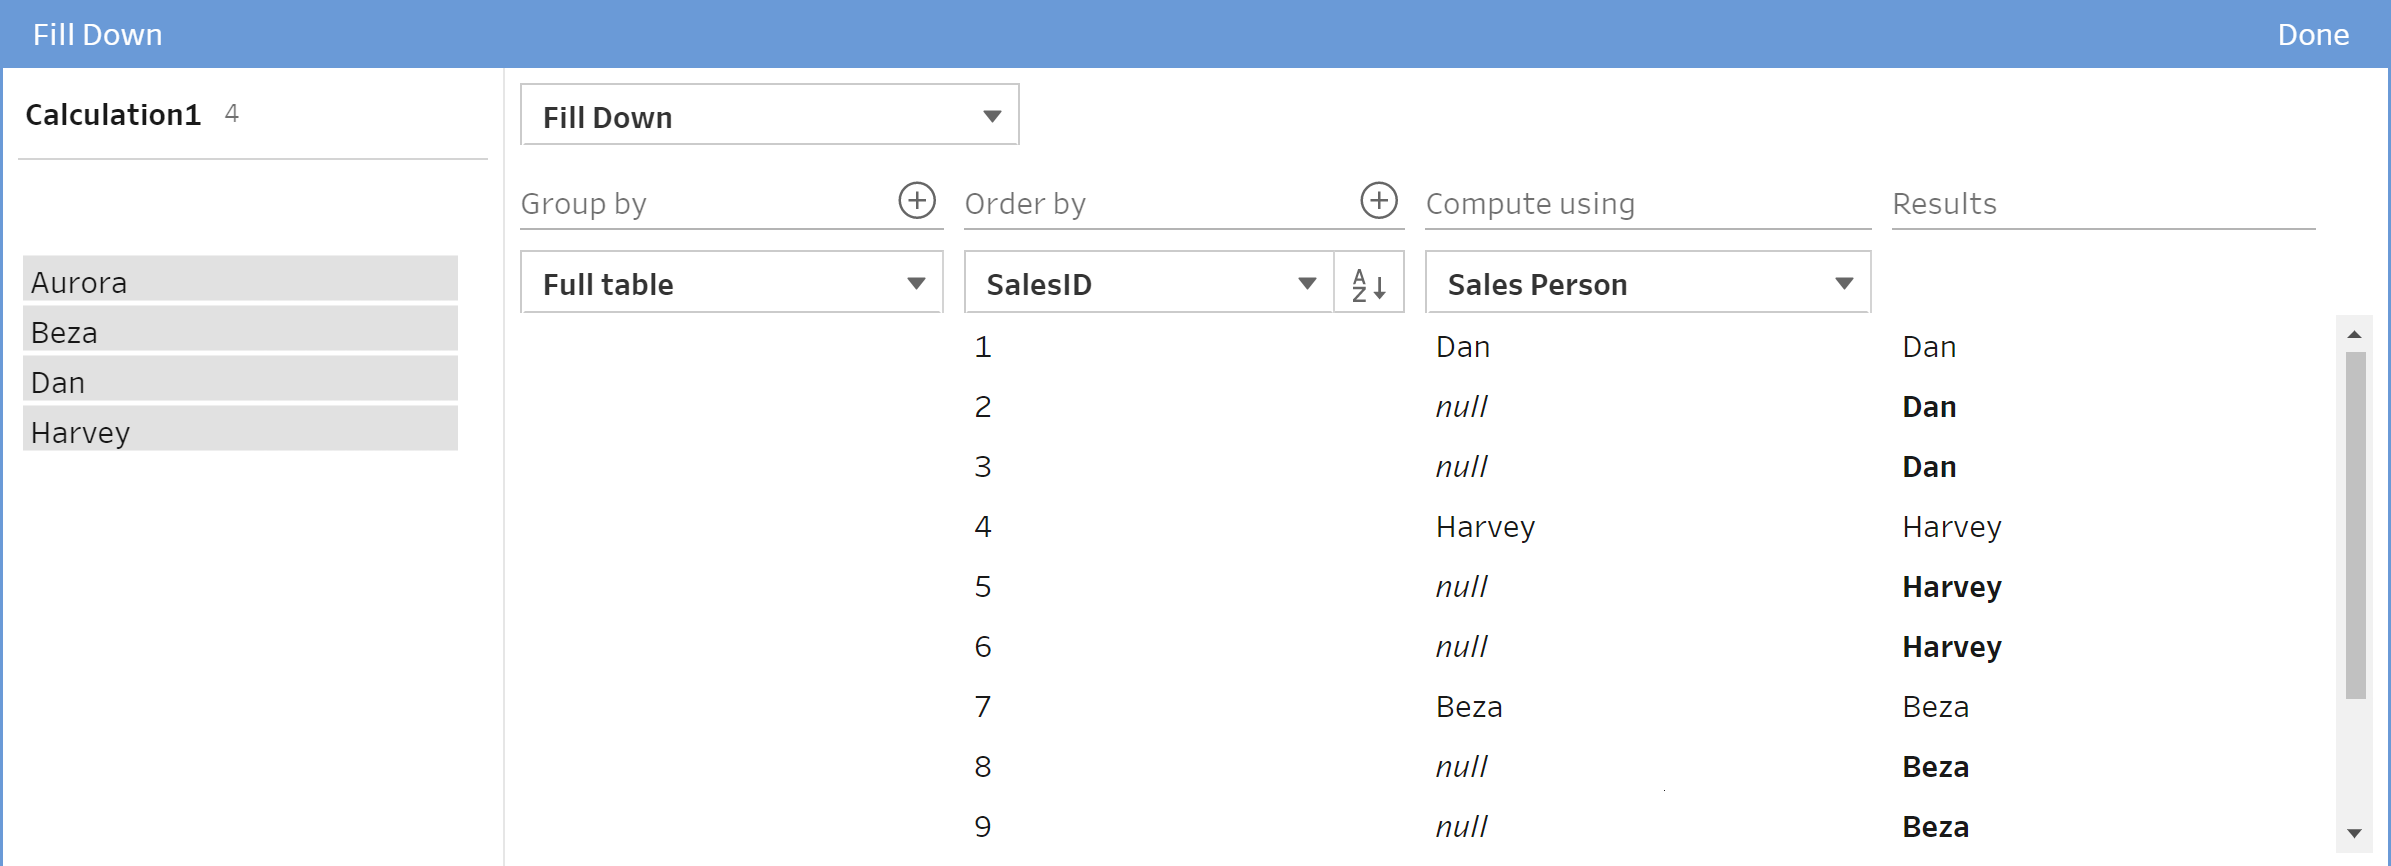
Another window will pop up allowing you to customize your Fill Down with three customizable settings. I like to read these from right to left.
Compute Using - This is the field you wish to apply the Fill Down too. Tableau Prep will look above for a value to add to the cell below.
Order By - This field sets the order in which the Fill Down is applied. In this case we have our Sales ID so Tableau Prep will look along every Sales ID row and apply the Fill Down. This can be sorted ascending as well as descending.
Group By - This will restart the Order By (the order in which we apply the Fill Down) for every new field in this column. We have no field to Group By in this example so we leave this to Full Table.
Step 4
Finally, we can rename our column and view our results.
Summary
By filling down values, Tableau Prep users can efficiently address missing or incomplete data, ensuring a more accurate and complete dataset for subsequent analysis or visualization in Tableau. This feature streamlines the data preparation process, enhancing data integrity and facilitating a more seamless transition to meaningful insights and visualizations in Tableau.
