


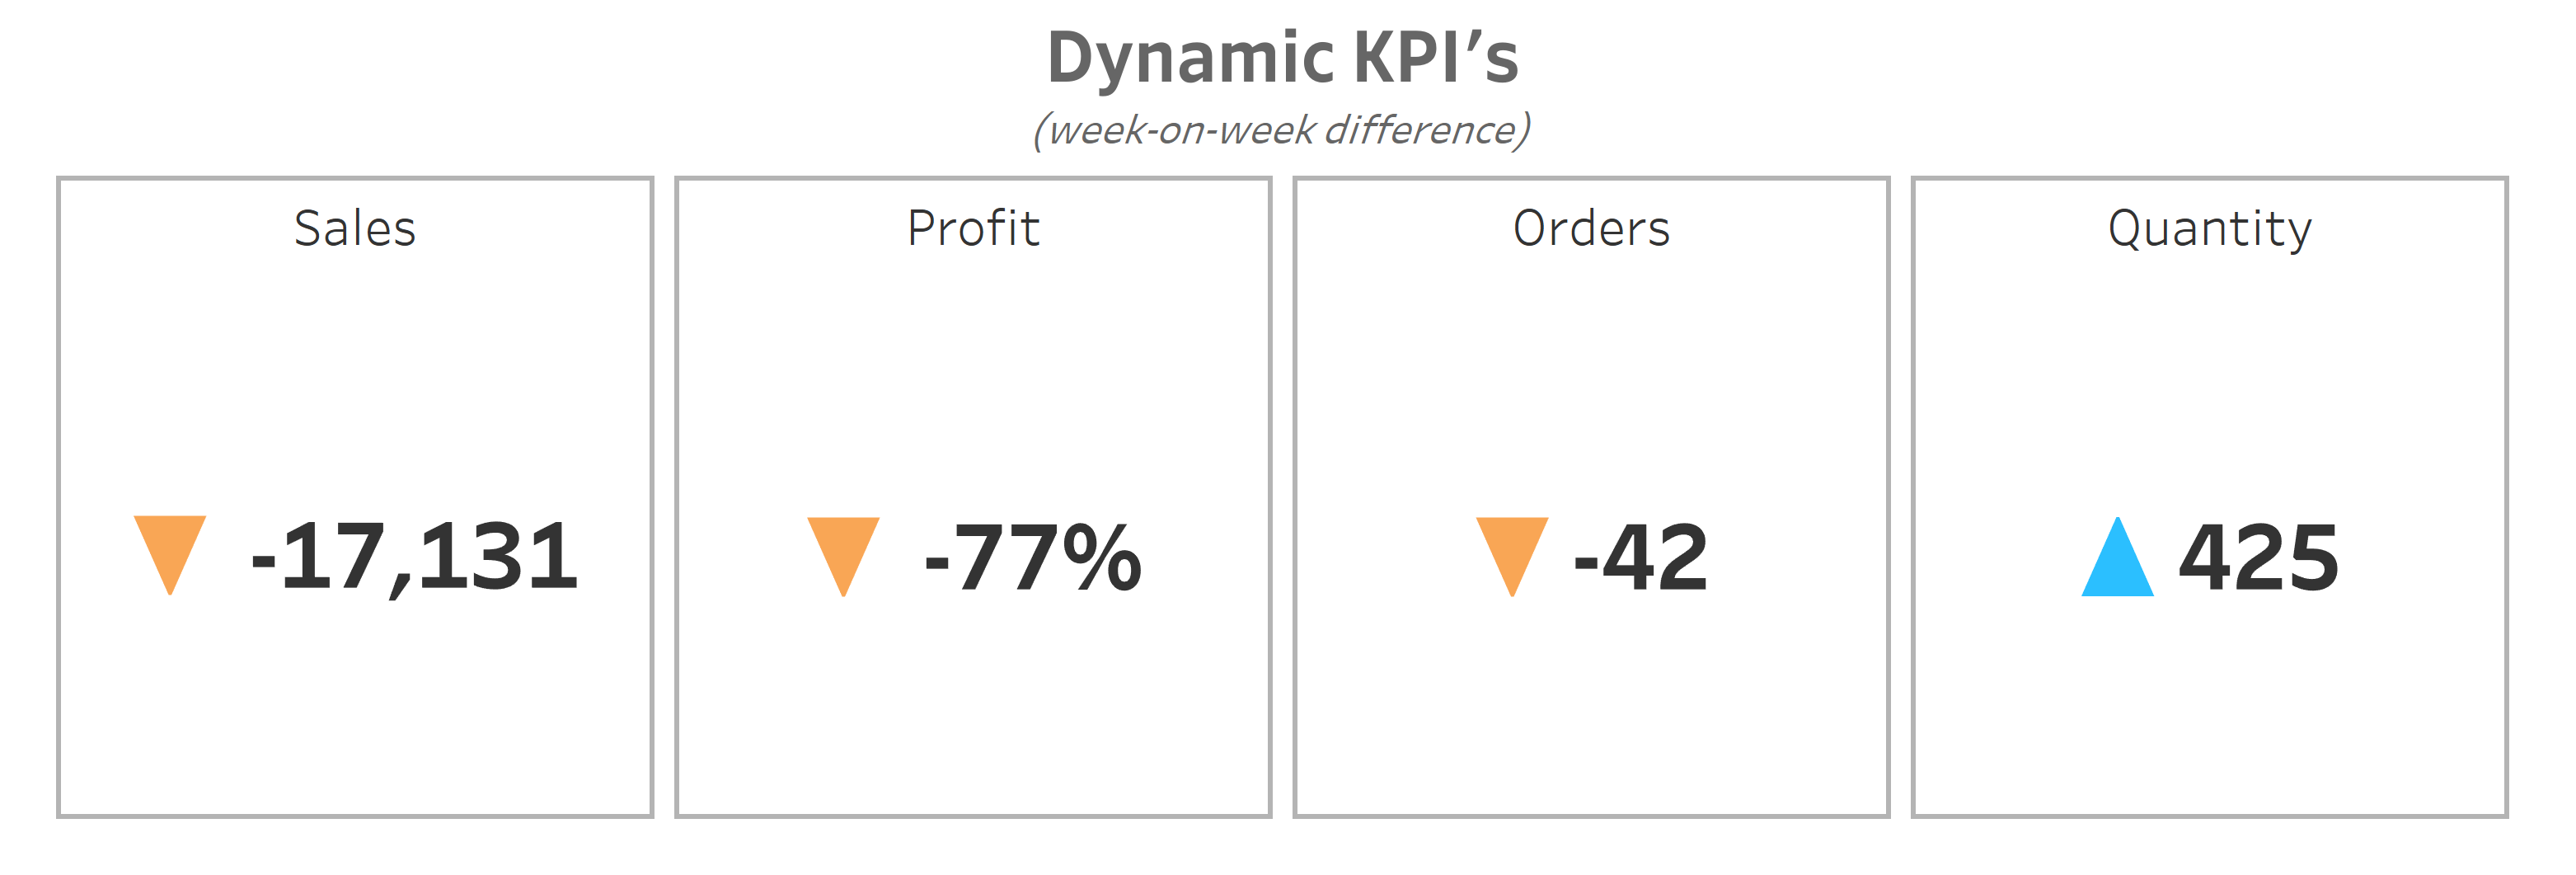
Dynamic KPIs are essentially numbers that update automatically as new data becomes available. Instead of being locked to a specific date, these KPIs always look at the latest period, so your dashboard stays current without requiring manual updates.
A good example is tracking sales on a week-on-week basis. Say you want to see if your sales this week are better than last week, a dynamic KPI makes that super easy.
You can achieve this with three simple calculations in Tableau using the Superstore sample data.
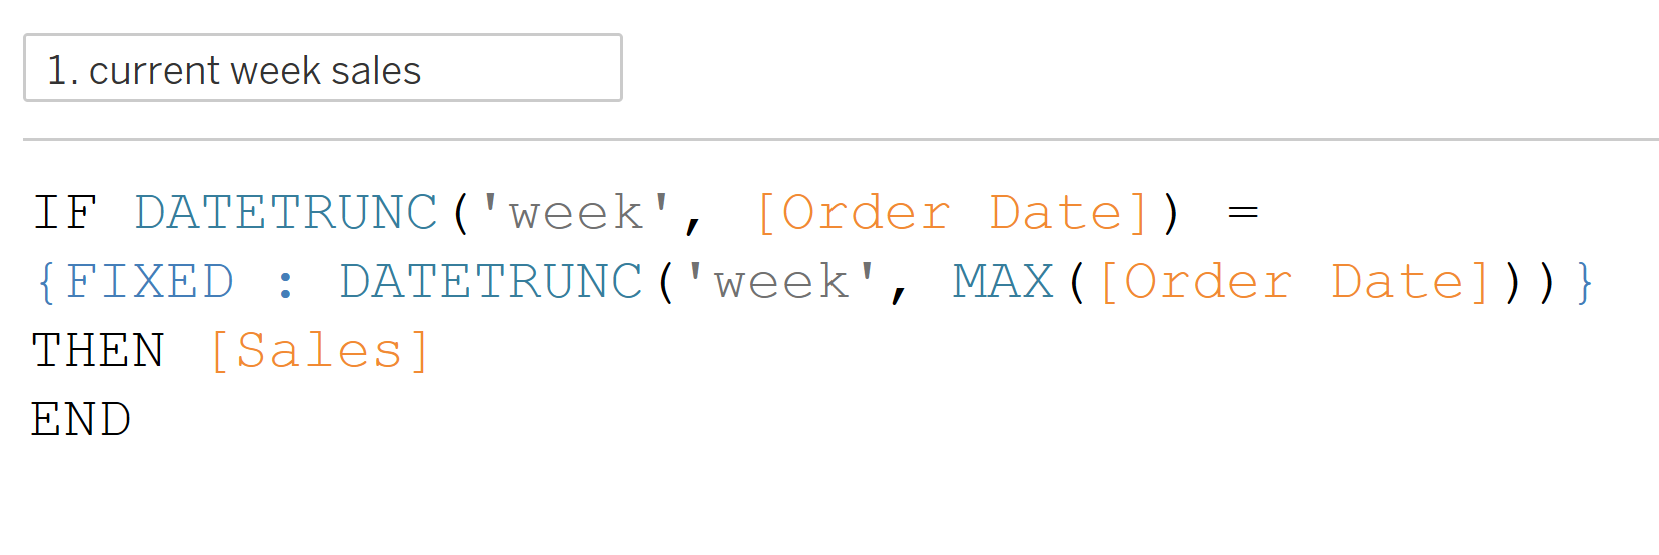
1) Current week sales
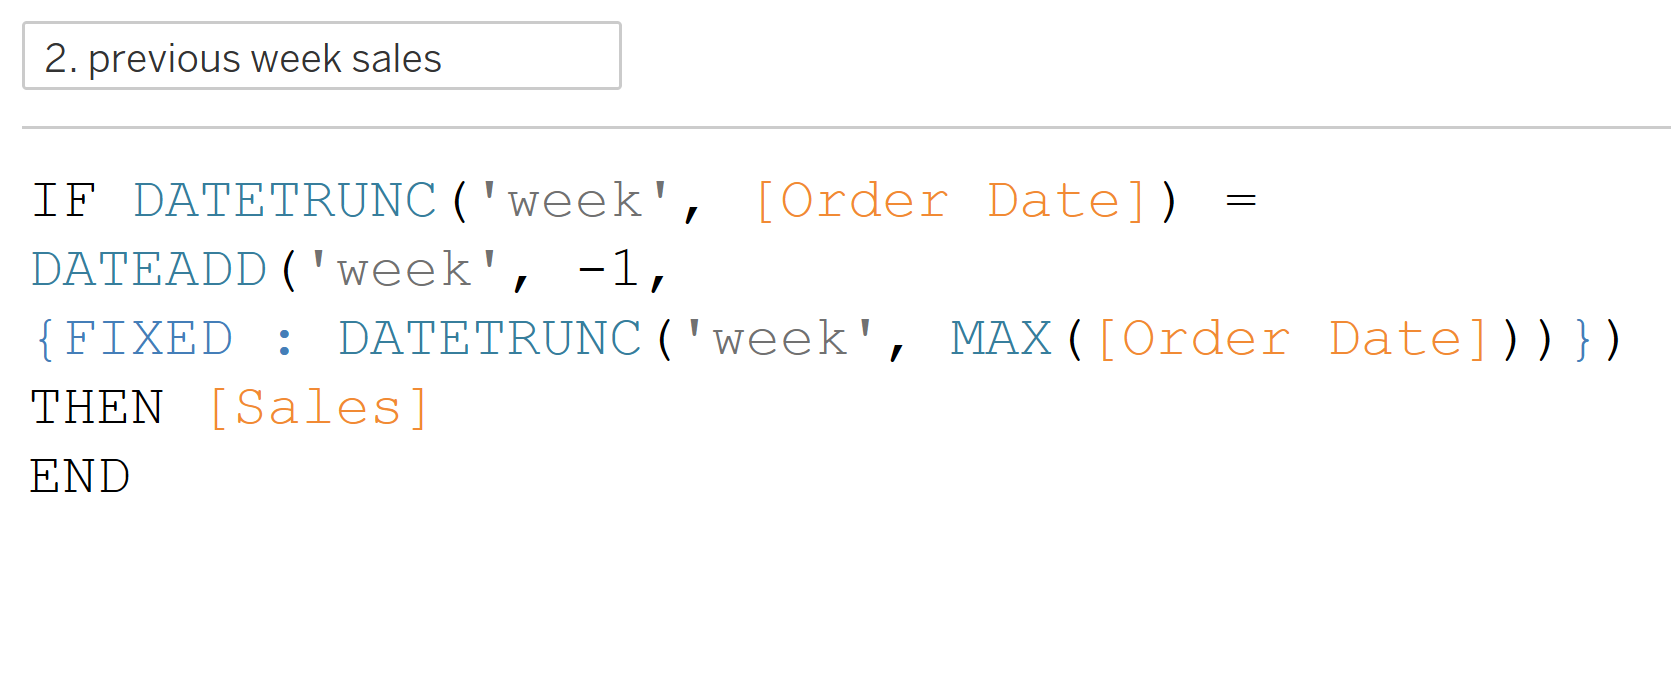
2) Previous week's sales
3) Week-on-week difference

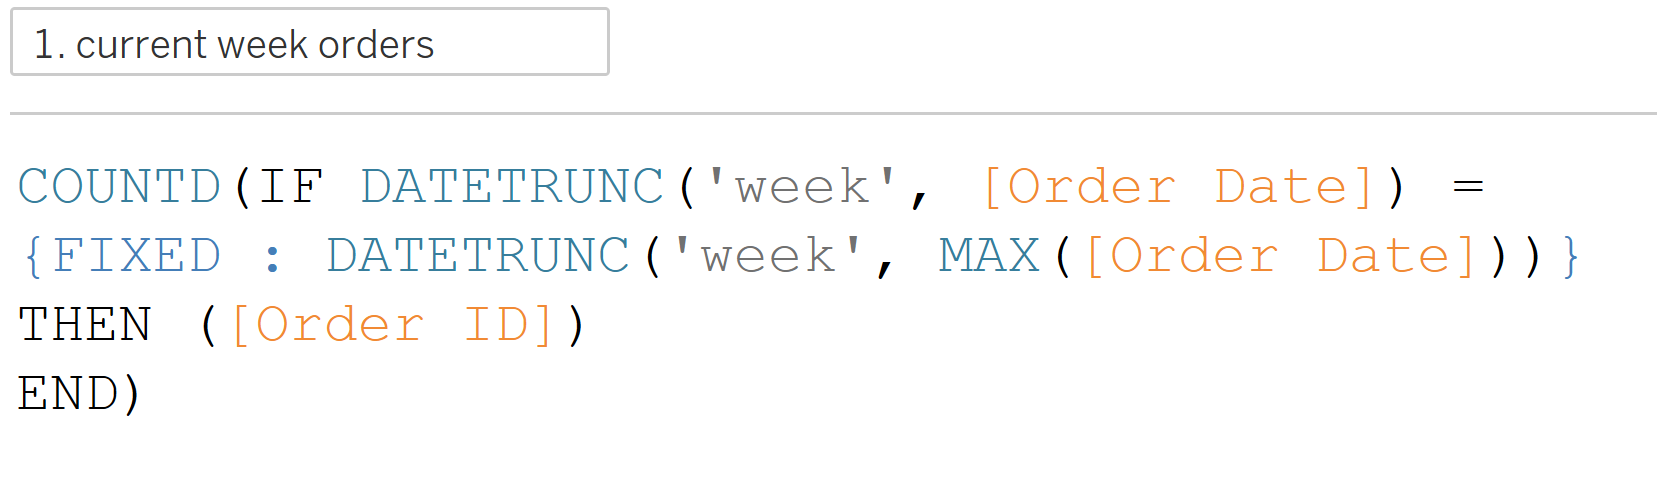
Orders are slightly different. For Sales, Profit and Quantity, we can just sum the numbers because they’re measures. Orders are based on the Order ID field, which is a dimension.
For this KPI, we wrap both calculations in a COUNTD function to count the distinct orders in each week.
For the week-on-week difference, we don't need to wrap the current and previous week's orders in a SUM, as they're already aggregated.
Key Takeaway
By focusing on whole weeks, the KPI is dynamic. Every time you update your data it:
- Picks up the most recent week
- Looks at the week before that
- Calculates the change.
It's a nice way to minimise extra work, no manual filters, no updating dates, your KPI just works.