


This week had a different structure, with a front loading of the client project and the Learn What The Data School Learns Public Session on Thursday.
Client Project
Due to scheduling the first two days of the week were both full days focused on the client project. This meant we were able to stay focused and on top of the project, but removed the useful time we have to decompress during the week, take a step back and evaluate where we are. The aim was to take pre-built dashboards that were created but had issues with the data models and actions not working as intended, and produce re-designed dashboards that streamlined the calculations.
This week we worked with a dataset that far exceeded the difficulty we had previously faced. As part of the data team, it took us a while to ascertain what we were looking at. Whilst row entries were manageable, some of the tables in the dataset had 300+ fields, across multiple different tables. Because the platform synthetic data we had is notoriously difficult to use, we knew it was not going to be straightforward. We had to review how the model was created by looking up the individual tables on the server. This became problematic once we identified not all the tables were available (which later turned out to be due to naming changes being different from the original dashboards). Once identified, we scoped out a plan on which tables we required from the original model, and how we would adjust the joins in the model. This remedied other issues, such as manager names not being available in the original model.
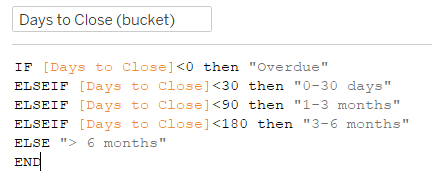
The next stage focused in on the issues within the Tableau Workbooks. The first was hard coding, which is embedding specific values or text directly into a calculation or the workbook, instead of linking them to an external data source. For example, there were IF statements coded in to the Parameters current value, instead of creating a calculated field and linking the parameter inside to create a dynamic adjustability. Another case shown below, was hard coding date buckets instead of using parameters that would allow the user to adjust the size of the buckets on the dashboard, which would have improved the interactivity.
The final part was creating the documentation for handover. We collated all of the notes around the reasoning behind the table joins we built, as well as the hard coding issues, the reason why it caused problems and the solutions we had for each. The data dictionary contained all of the calculations we created, which assisted in slimming down the size of the calculations caused by the hard calculations present in every dashboard. The original fields were hidden on the new dashboards, providing the option for the company to remove them completely or implement our suggested changes.
PowerBI DAX
We continued on from Week 7's work with DAX, learning about using the Date Table for dynamic filtering and time intelligence, such as the SAMEPERIODLASTYEAR function. Having a consistent date hierarchy allows for filtering and drilling down through the data. We continued to use the CALCULATE and X functions in PowerBI, which enabled some interesting dashboards to be created. In other blogs, I detail and explain how these functions were used and what I learnt from each, in the Chocolate Index Dumbbell Chart and Progress Bar dashboards.
Learn What The Data School Learns
On Thursday we had the opportunity to practice our teaching skills in the LWTDSL public sessions. This gave DS53 the chance to practice leading a workshop where people signed up to attend either a Tableau or Alteryx set of 4 classes, covering the basics to intermediate level tools. This challenged myself both in the length of time engaging and audience, but also preparing content and having to understand fluently enough to teach others and answer questions that may arise on the spot. You can read more about my LWTDSL experience here.
Next week is a return to the norm, with a PowerBI client project and Alteryx. We have the opportunity to shadow a fellow DS'er on placement and learn about the work they do on a daily basis, which should prove interesting.