


Creating interactive KPIs are a sure way to elevate any dashboard you create. One way is to use calculated fields and dates to create different periods in time in which to view the data. This blog will cover how to create a Current Day Profit vs Same Day Last Year Profit KPI, using the Superstore Dataset.
1. Creating "Select a Date Parameter"
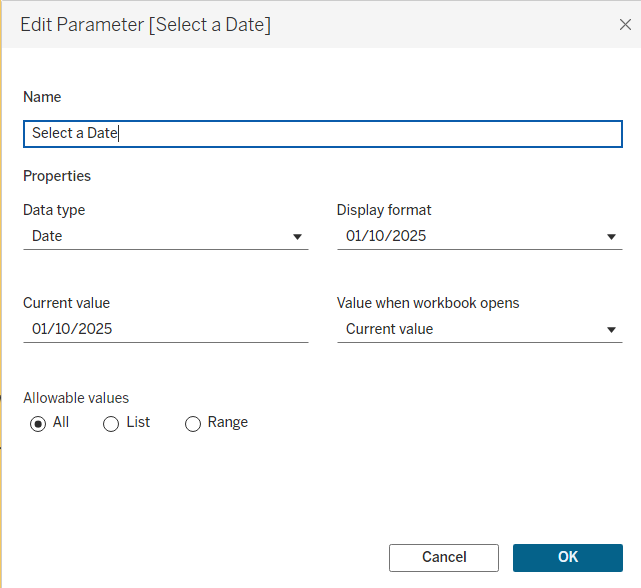
Click on the down arrow on the data pane and select create a parameter. Then rename it, change the data type to Date, and allow all values. (You could also select range if you only want users to view a specific subset).
- Creating the "Current Day Field"
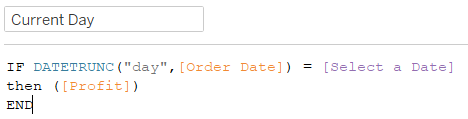
Select the data pane arrow again and choose "Create a Calculated Field". Rename it to Current Day. The logic behind the IF statement is that we want the Order Date to match the parameter selected date, at the day level, and then for the Profit on this day to be displayed. The DATETRUNC aggregates the date to the level you specify. Here, the "day" has been specified to the day level. After the comma, we input the date field we are basing this on, which is Order Date in this case. We set it equal to the Select a Date Parameter. The section Then [Profit] tells the function to display the profit when this condition is met, and the function is complete, so we can enter END.
- Creating the Same Day Last Year Calculated Field
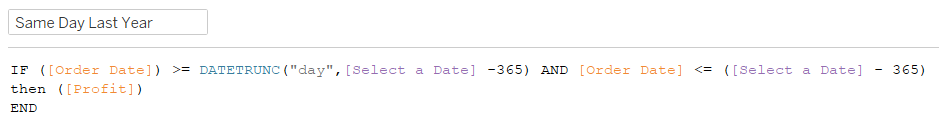
Select create a calculated field, and rename it to be "Same Day Last Year". The logic for this IF statement, is if the Order Date is above or equal to the parameter 365 days ago (one year) at the day level, AND Order Date is less than or equal to the Date parameter 365 days ago, then show the profit for this period.
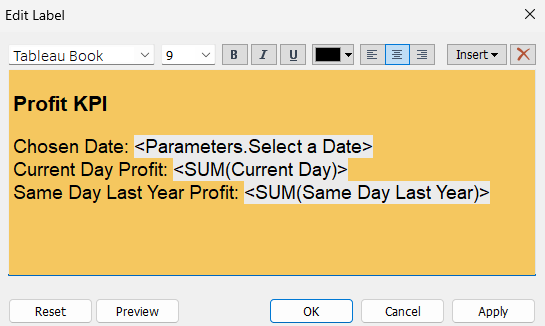
4. Creating the KPI
Now that the fields have been created, drag both onto the Text option in the Marks card. You can also drag the Select a Date parameter onto the Text option, and from the data pane right click and select Show Parameter. Then click on the Marks Card, then the ellipses next to the Text.
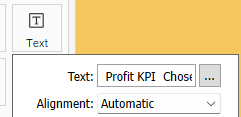
You can then edit the text to appear how you want the text to appear in the KPI. Below is the formatting I have chosen to show, with a title of Profit KPI, and then the values and the parameter along with the labels for each.
Below is the basic template of how the KPI can look, you can fell free to jazz up your dashboard as much as you would like to. I hope this walkthrough has been helpful! Below is some of my fellow DS53's blogs on other date KPI's you can make.
- Current YTD vs PYTD https://www.thedataschool.co.uk/joss-lazenby/date-kpis-in-tableau-current-vs-previous-year-to-date/
- Prior 12 months vs Previous 12 months https://www.thedataschool.co.uk/ash-aravindhan/step-by-step-guide-to-year-over-year-kpi-analysis-in-tableau/
- Current month vs Prior month https://www.thedataschool.co.uk/joe-hughes/contextualise-your-kpis-current-month-vs-month-prior/
- Current Month vs Same Month Last Year https://www.thedataschool.co.uk/james-gastaldello/context-to-kpis-current-month-vs-same-month-last-year/
- Current Month to Date vs Prior Month to Date
- Current Month to Date vs Same Month to Date https://www.thedataschool.co.uk/olivia-grace-yuki-millar/kpis-current-month-to-date-profit-versus-same-month-last-year-to-date-profit/