You’ve got server deployed in your company. You’re wondering if it’s working. What are the engagement numbers like? How often are people visiting different dashboards? Is your server performing quickly enough for the traffic it’s generating? Server has built-in tools which will allow you to see basic information about all of these things.
![]()
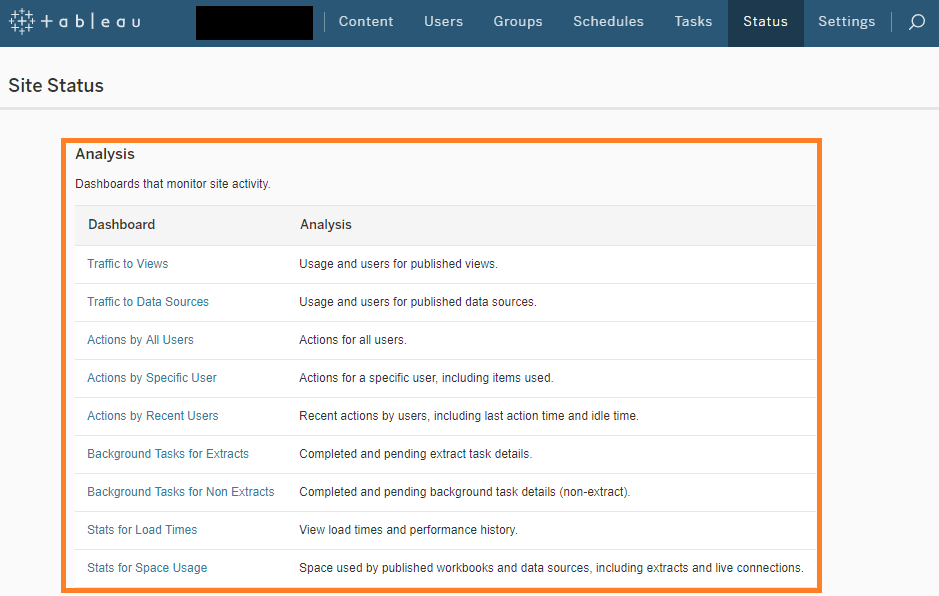
Open server in browser, and select ‘Status’ from the navigation bar at the top of the window.

From here you’ll be taken to a page listing all of Tableau’s built-in server analysis dashboards. They aren’t the prettiest things, but they might allow you to find some useful insights about how people are interacting with your server-based content!
