Have you ever wanted to give your dashboard the ability to switch between several charts or change out text boxes? If so, you should learn about Dynamic Zone Visibility (commonly referred to as DZV).

Yesterday I was doing Makeover Monday 2024 Week 14 and created a dashboard showing what percentage of Americans in different groups know that antibiotics cannot cure viral infections. The centerpiece of the dashboard is a donut chart that shows a different breakdown based on a parameter. The user can choose between age/gender/income/education using a parameter to update the donut chart. I wanted to write a bit of analysis for each view that would change based on the selected parameter. This was a perfect use case for DZV!
Here are the general steps for implementing DZV and how I applied them on this dashboard.
- On a dashboard, have elements in mind that you want to switch between in the same place.
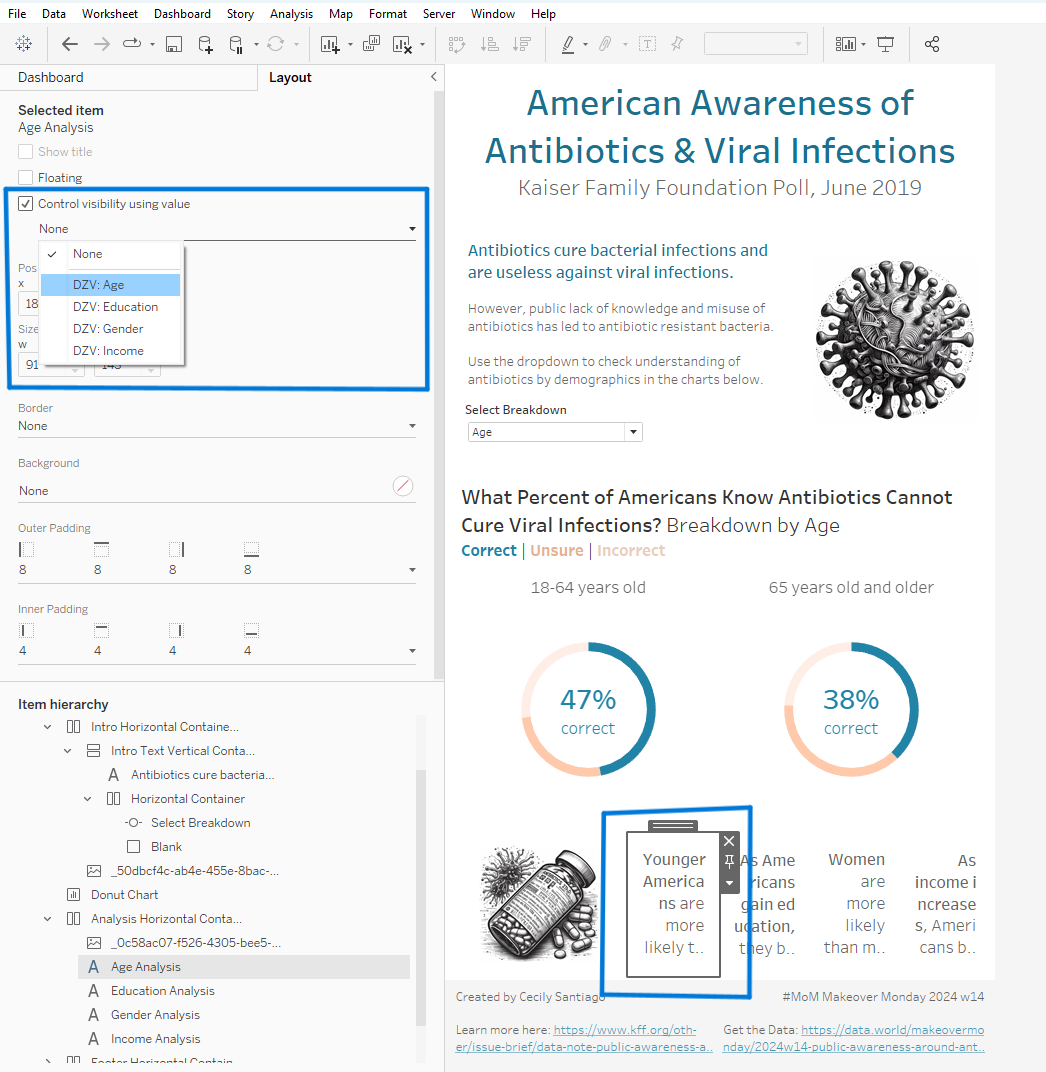
For me, this is the analysis text. You can see my desired result below with the parameter and text elements in blue squares. When the user changes the breakdown parameter, the text below the chart changes.


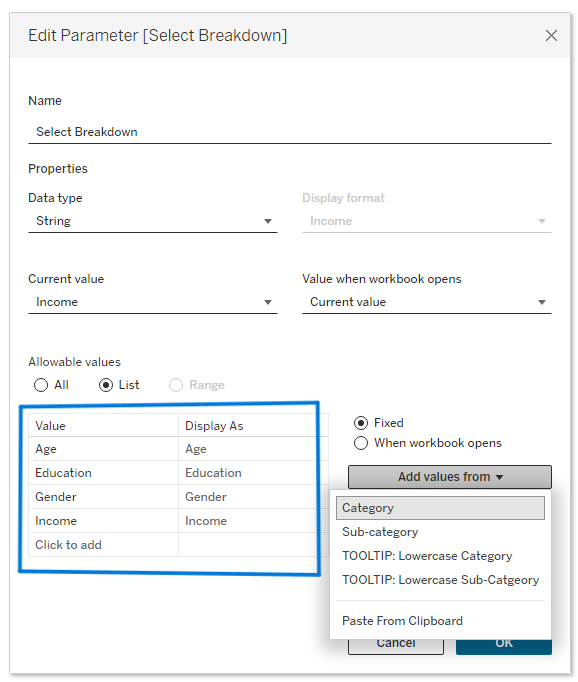
- Create a parameter with an option for each element you want to switch between.
Since I wanted to switch between the four different demographic breakdowns, I needed an option for each, so I created a fixed list of strings for the options by adding values from the "Category" field.
This parameter is also used to filter my donut chart, which I won't detail here. Using the same parameter for both filtering my chart and controlling DZV ensures that my text boxes switch out when my chart updates.
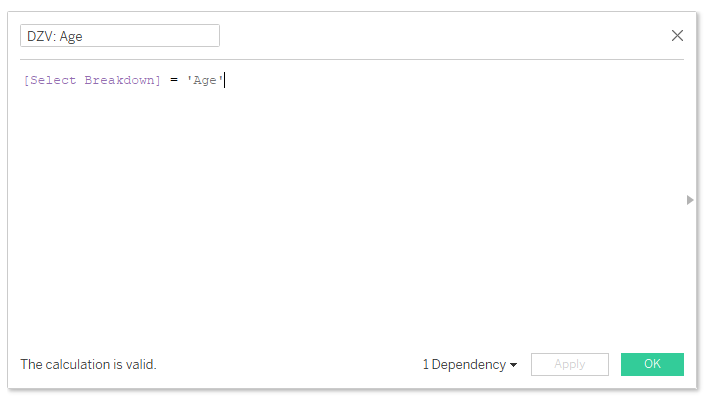
- For each element you want to switch out, create a Boolean calculated field that will return TRUE when that element should be visible and FALSE otherwise.
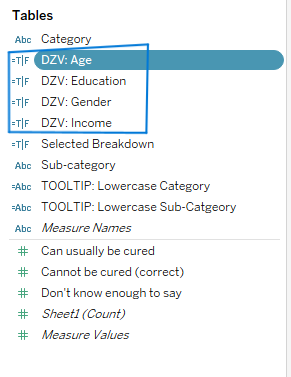
These will be based on your parameter, so when your parameter switches, the value of the calculated field switches. This is as simple as checking whether the parameter is set to a certain value: [Parameter Name] = 'Desired Value.' I repeated this four times, once for each of my breakdowns.
[read blogs about calculated fields]
- Place all the elements you want to switch between next to each other on the dashboard.
In my case, these were four text boxes, . However, these can be any type of object a dashboard can hold: charts, images, entire containers, or any combination. These will look squished right now, until we implement the DZV.

[read blogs about dashboard containers]
- Implement the DZV for each object:
- Select the object on the dashboard.
- Go to the "Layout" panel.
- Check the box "Control visibility using value."
- Change the drop down from "None" to the calculated field that returns TRUE when this object should show.
- Repeat for each object you want to switch out.
Once you do this, you'll be able to switch which object is visible by changing your parameter! I used a simple drop down parameter, but you can add parameter actions to your dashboard to make this more interactive.