


- Right click and drag order date onto column and select year.
- Then Right click and drag order date onto column and select quarter.
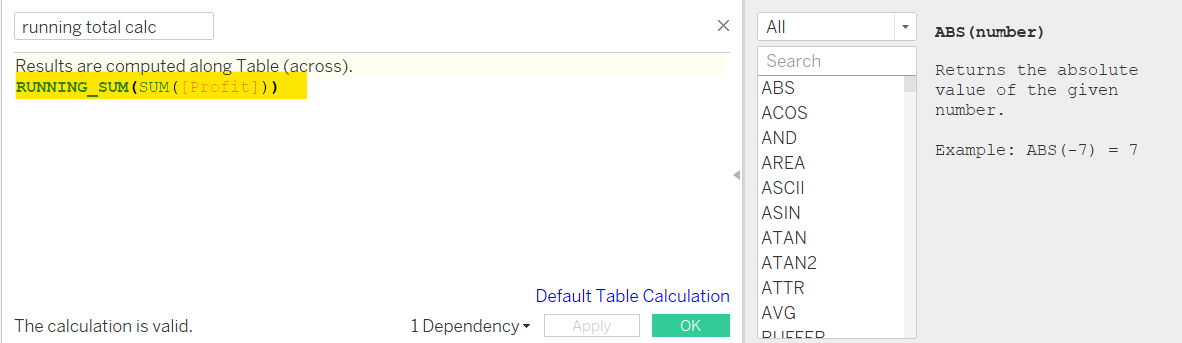
- Create a calculated field and name it 'running total calc' (always name your calculated field to something you remember!).
- Start your table calculation with 'Running_Sum' so it returns the running sum of the given expression, from the first row to the most current row. Followed by '(SUM[Profit]))'
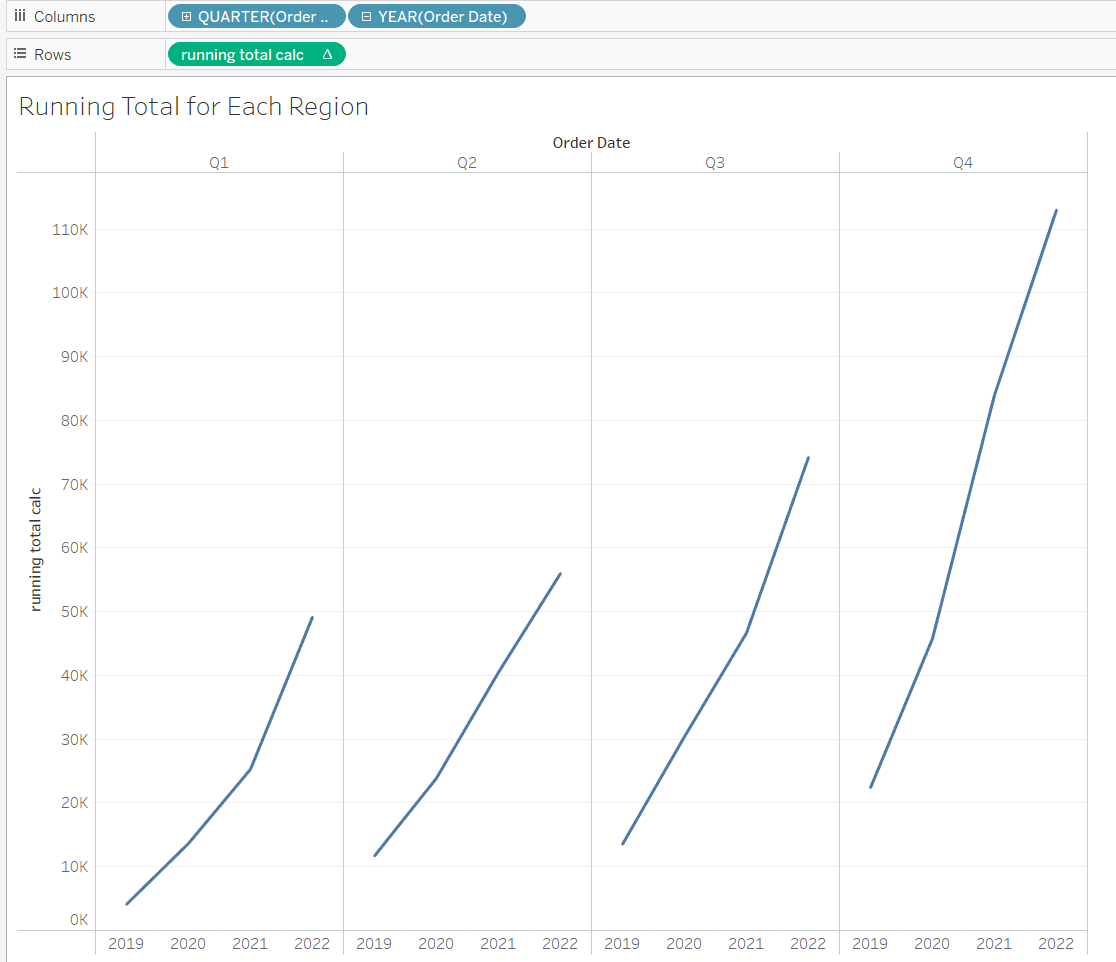
5. Drag this calculation to the rows

6. Then your graph will appear like this
7. Drag region onto color
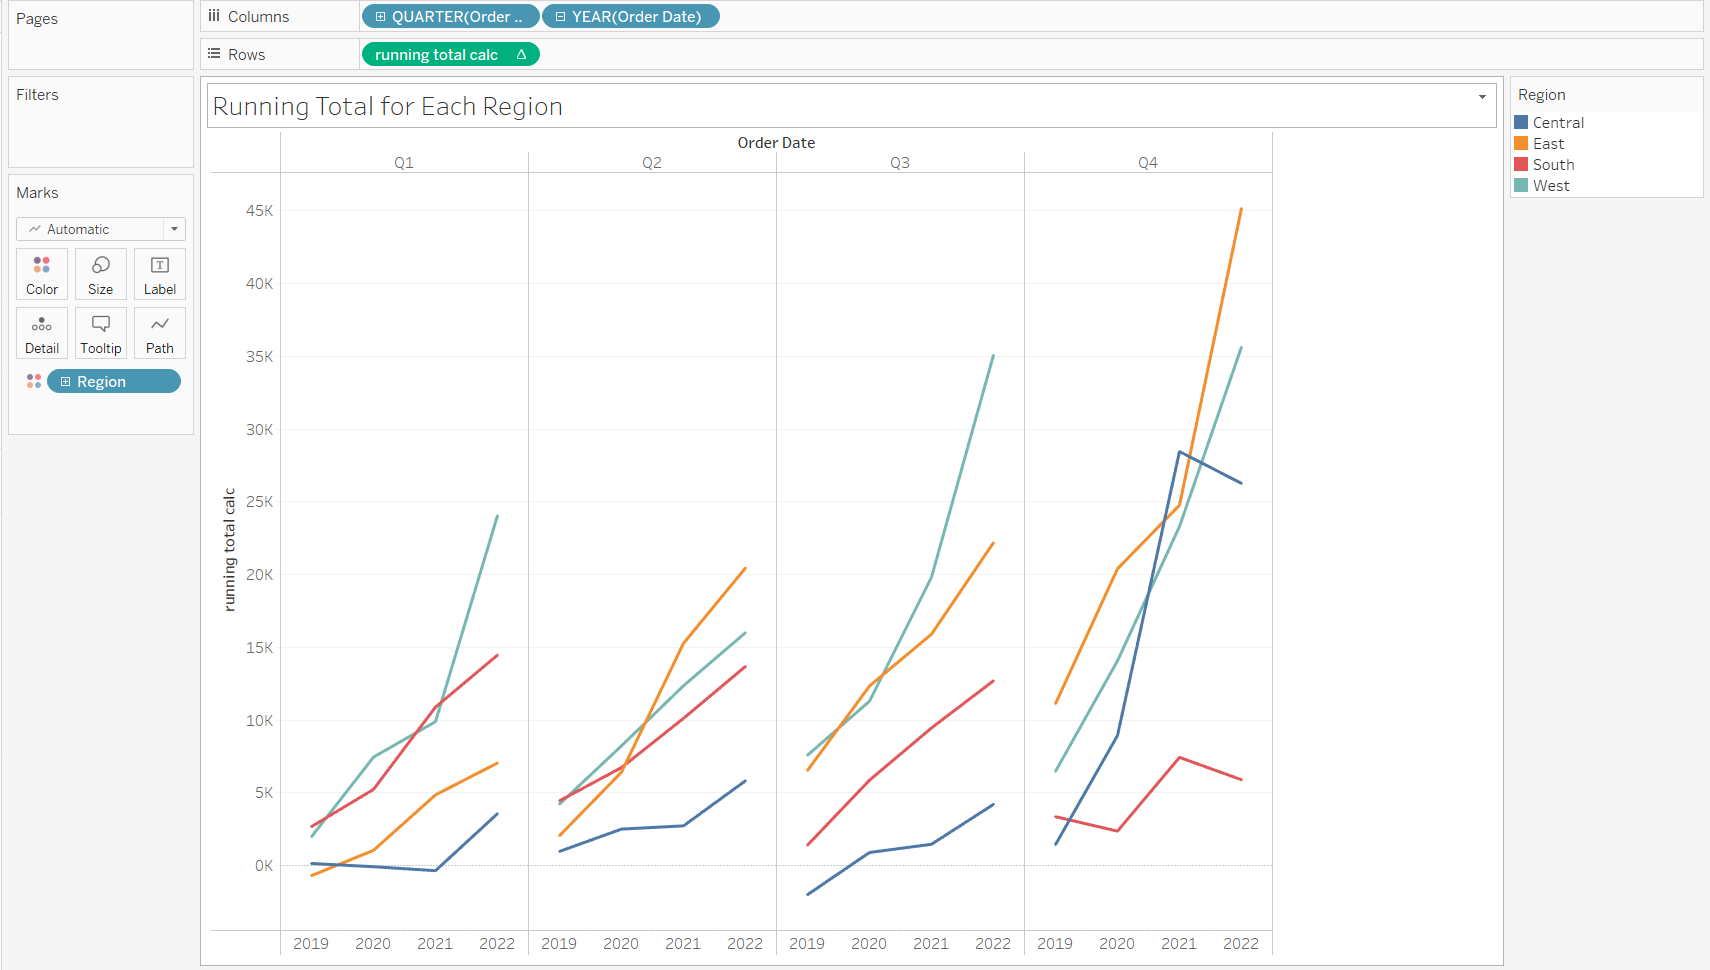
That's how you create a running total calc