- (Probably one of my favorite graphs to create in tableau)
- Drill down charts allow you to gain useful insights when looking at multiple things within your data.
- Allows you to gain deeper insights all within one chart
- Engaging experience for the user
- More detail on view without taking up lot's of space
So here's a step by step guide:
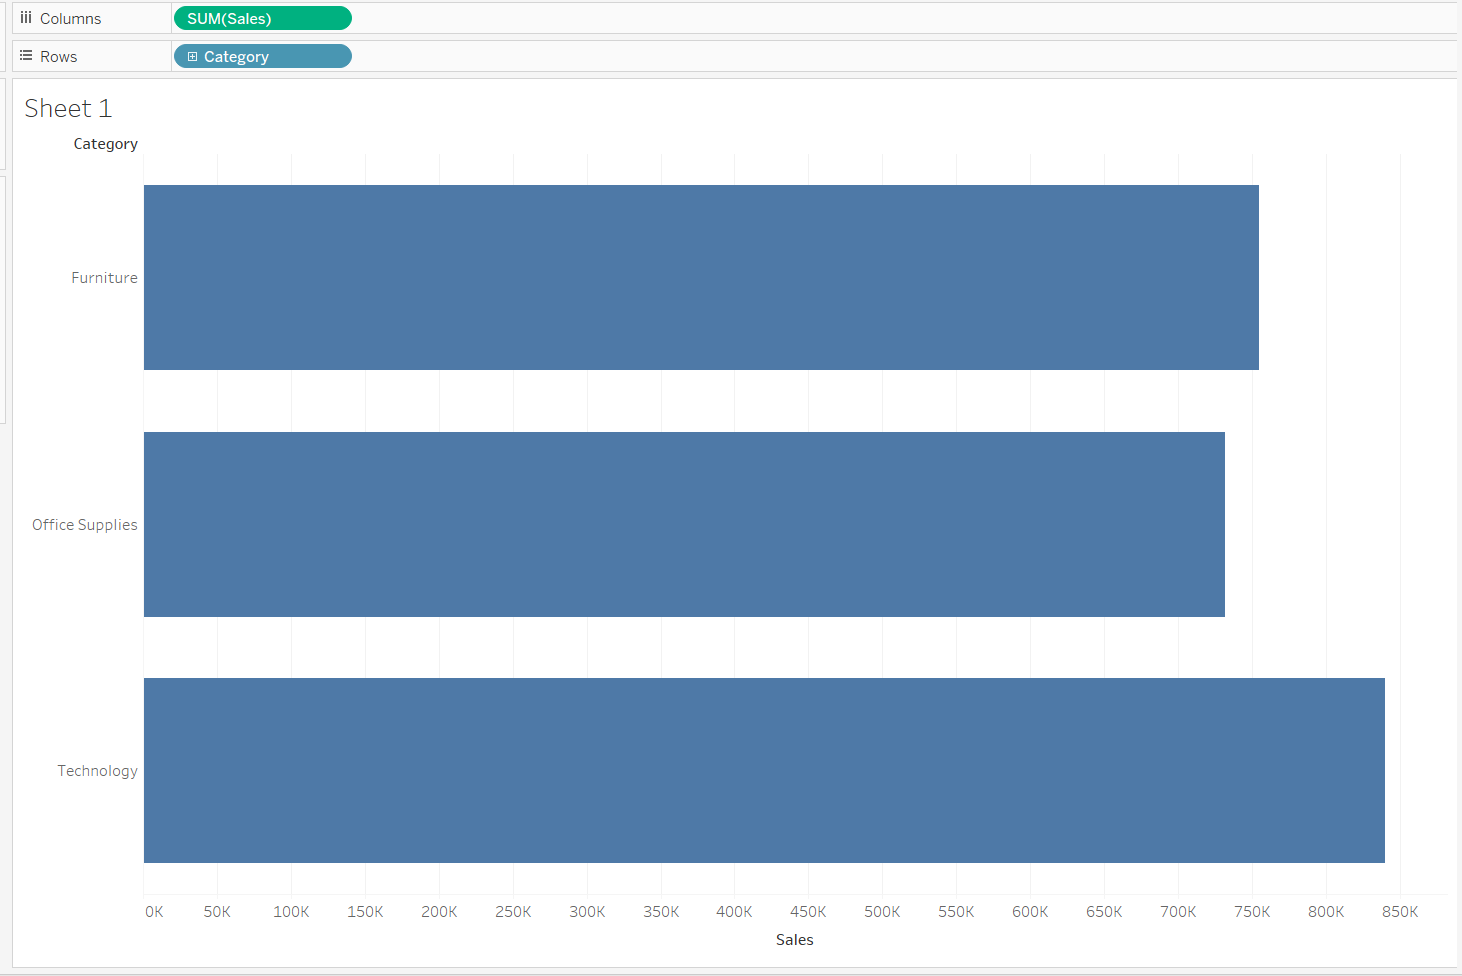
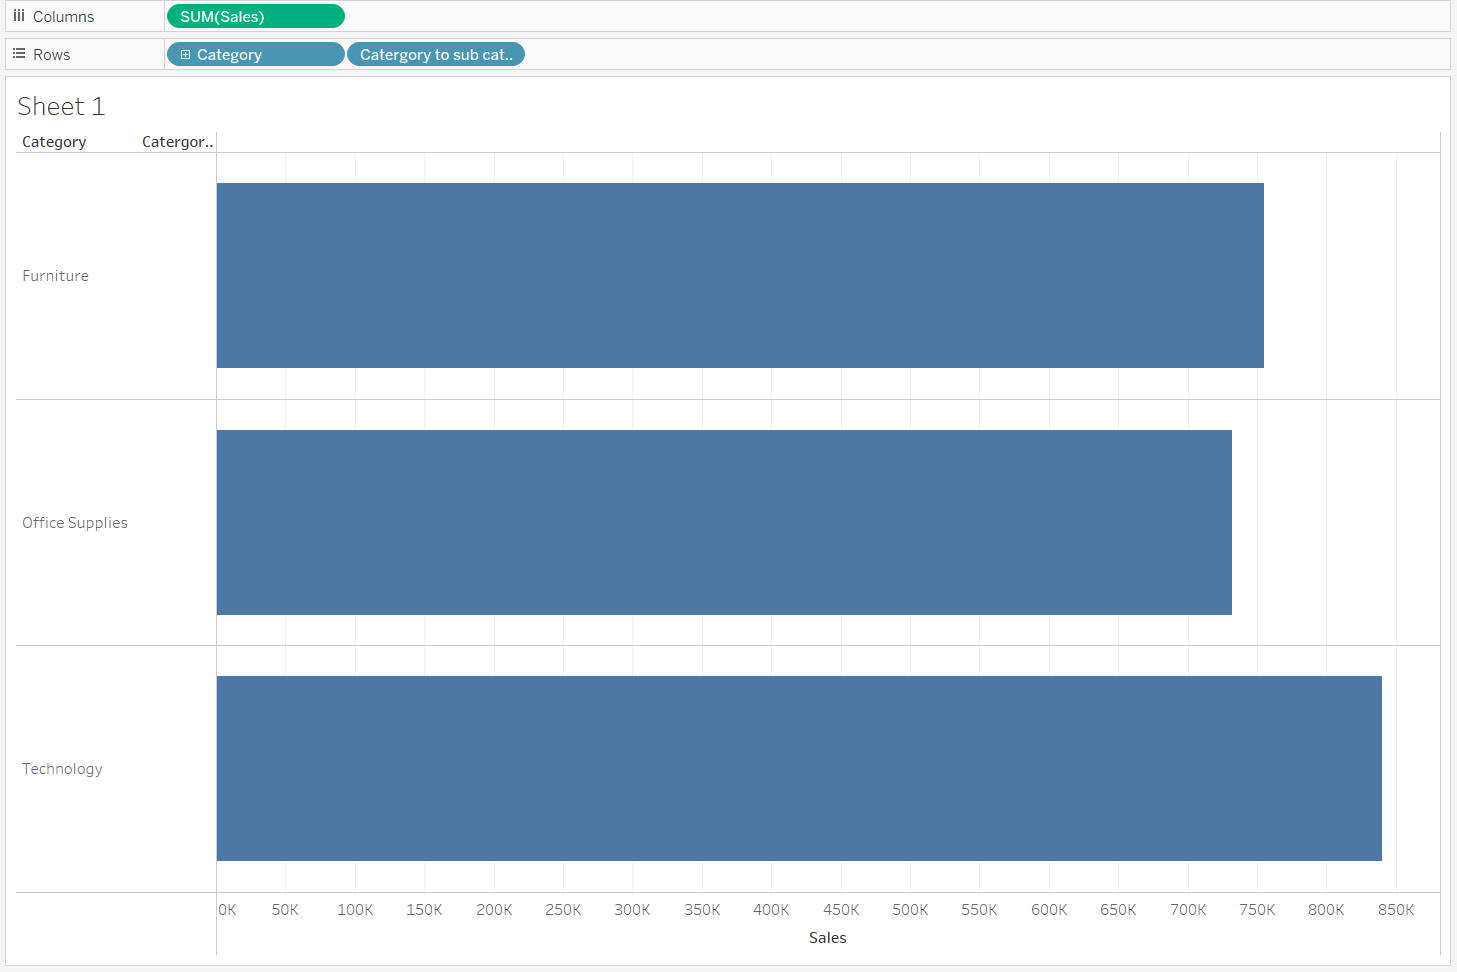
- Put Category onto Rows and Sales onto columns
- Select Entire view
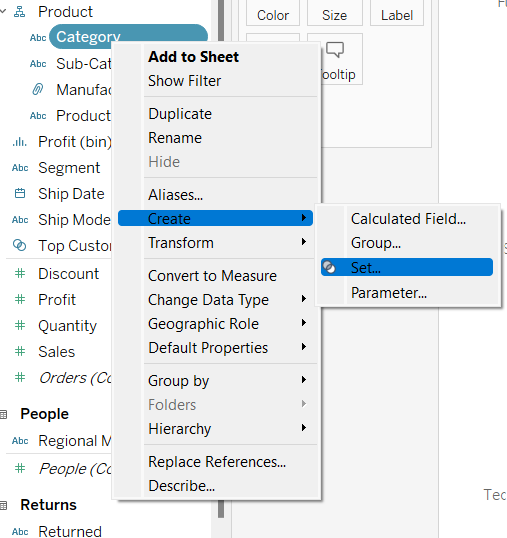
3. The right click on category to create a set, leaving all categories unti
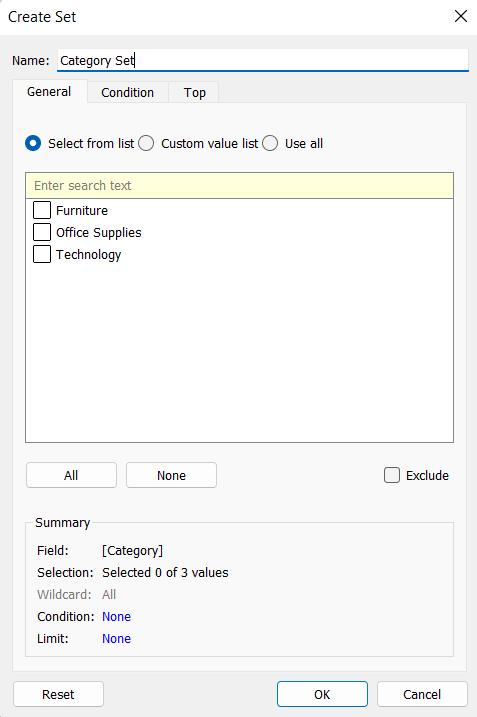
4. Leave all categories untick
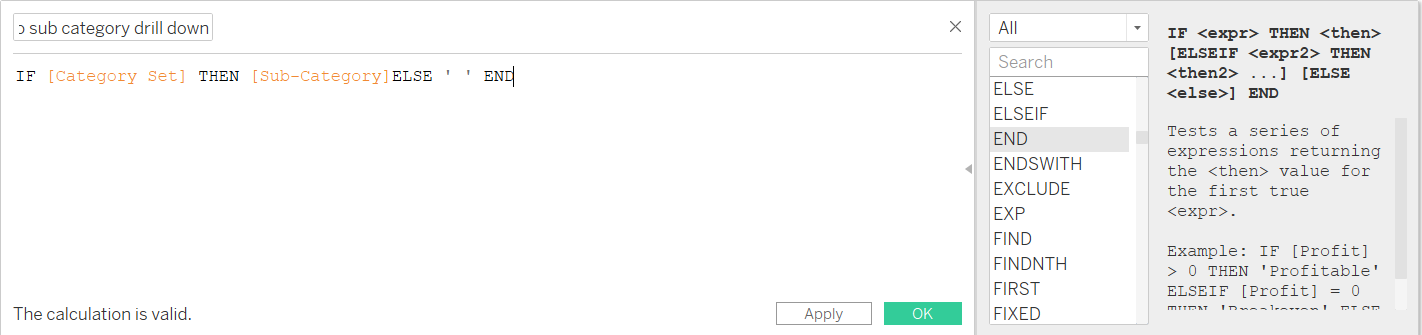
5. Now you have your category set. Create a calculated field (Always name your calculated fields something sensible so you don't forget!) in this case I've name it 'Category to sub category drill down' this will allow for the drill down action to work.
6. Drag the calculated field so 'Category to sub category drill down' on to rows
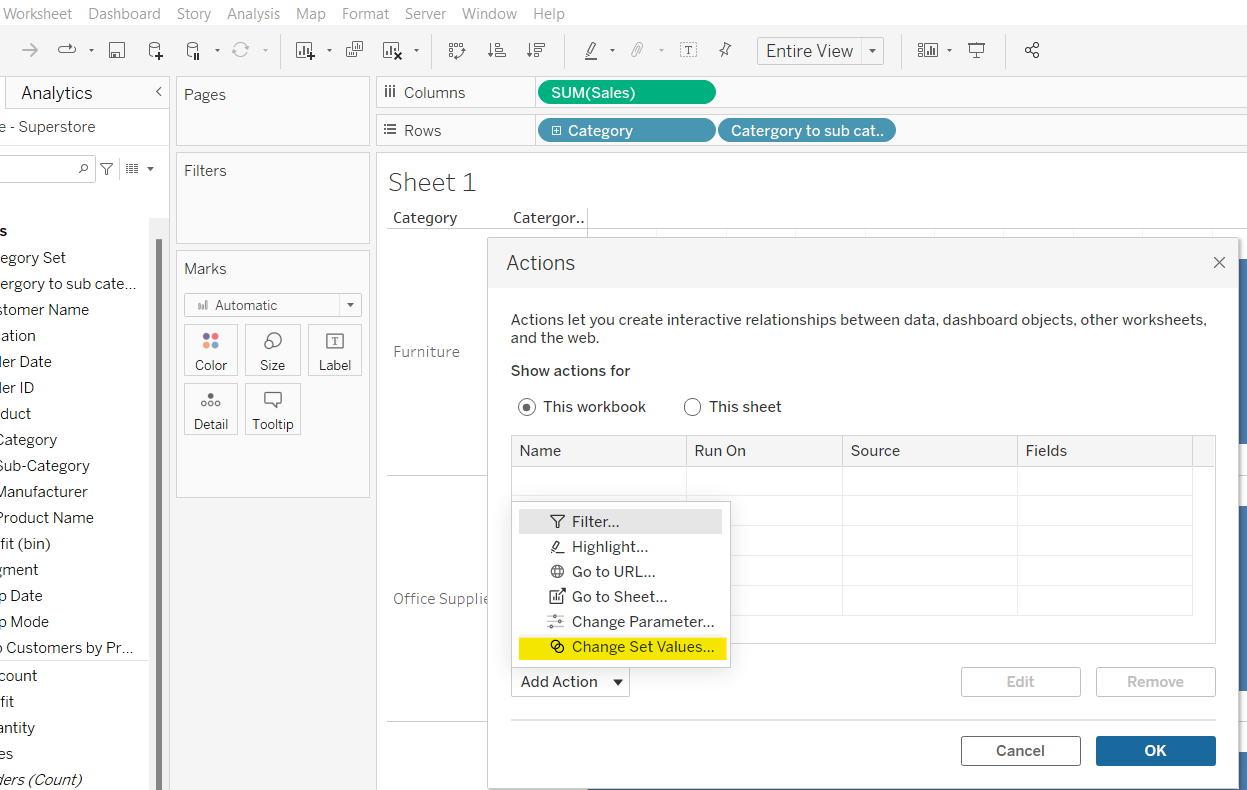
7. Click onto worksheet >actions > add actions > Change set values
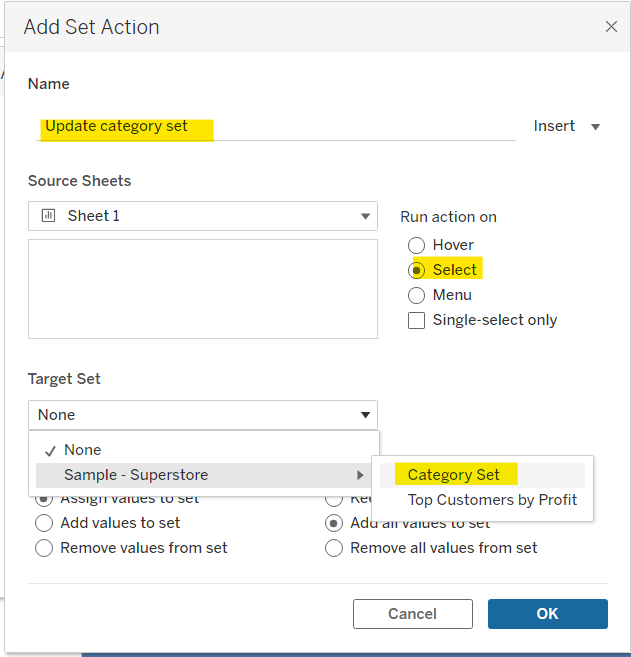
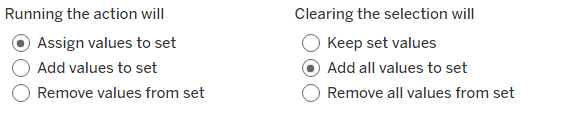
8.Now Add Set Action , and the category set as the target set
9. Now click on a category, to drill down into the sub category to see how much sales each one generates
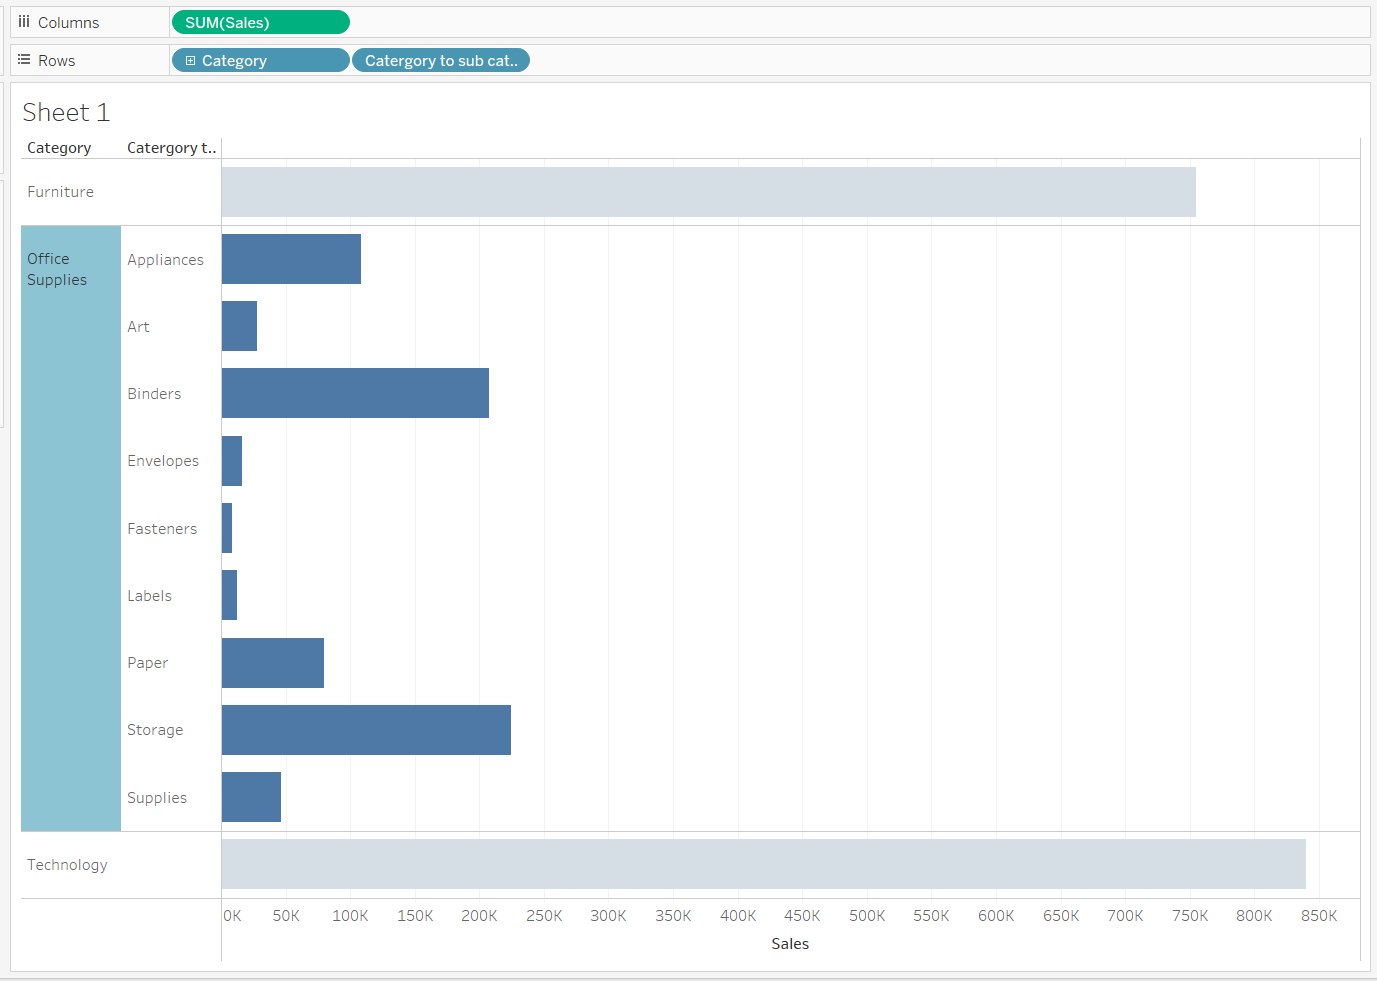
Finished! Now you have a drill down chart