


Making sure progress is made.
- Started of with making a more detailed plan
- Research! Getting stuck into the data! I made sure I conducted thorough research on the museum data. Focusing on who, what, where, why and how?
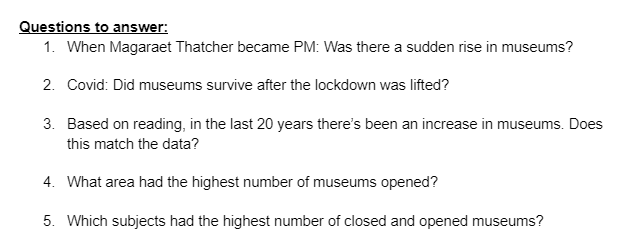
Questions: Then wrote down a list of questions I wanted to use the data to answer and focus analysis on.
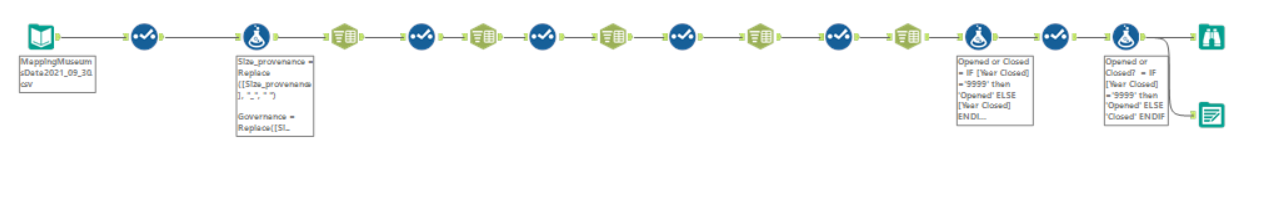
Cleaning the data: Went into Alteryx to clean the data, remove unwanted columns renamed fields and change field types
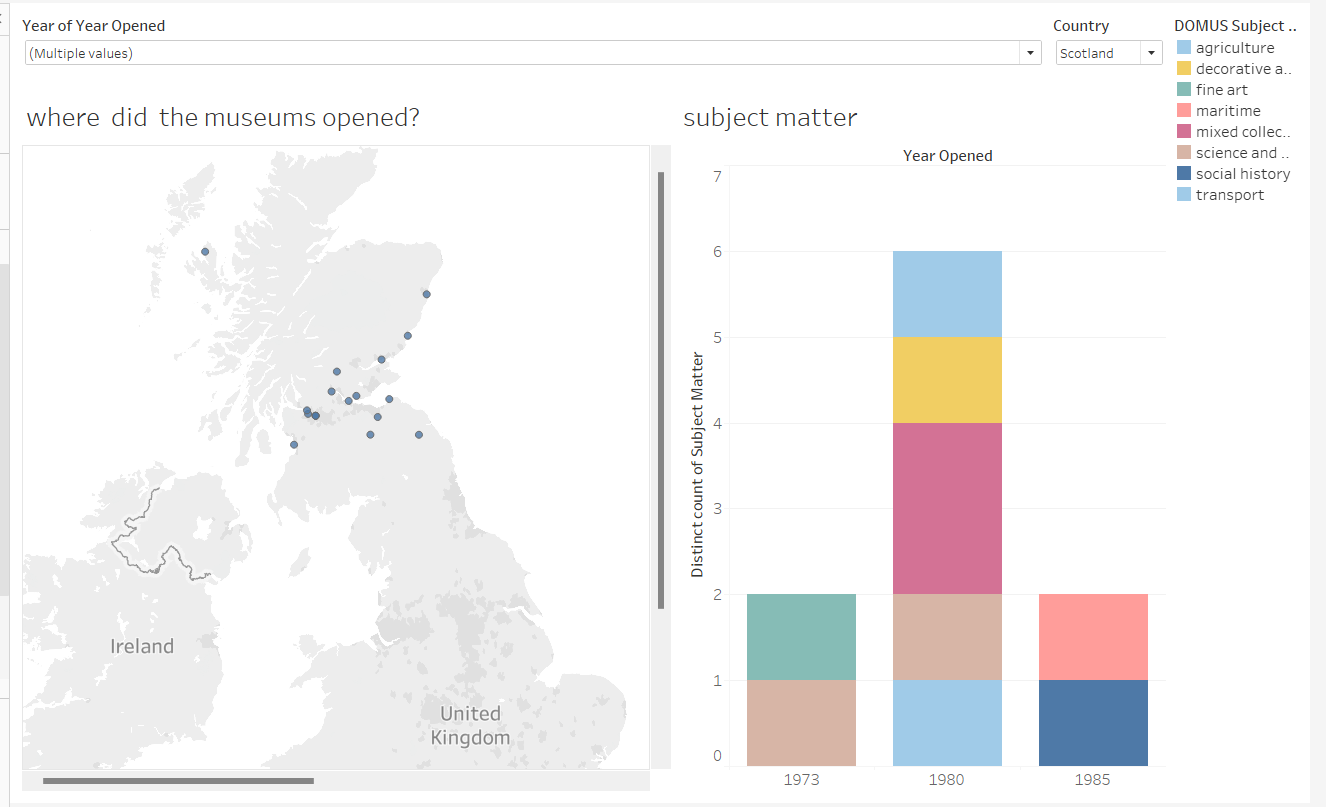
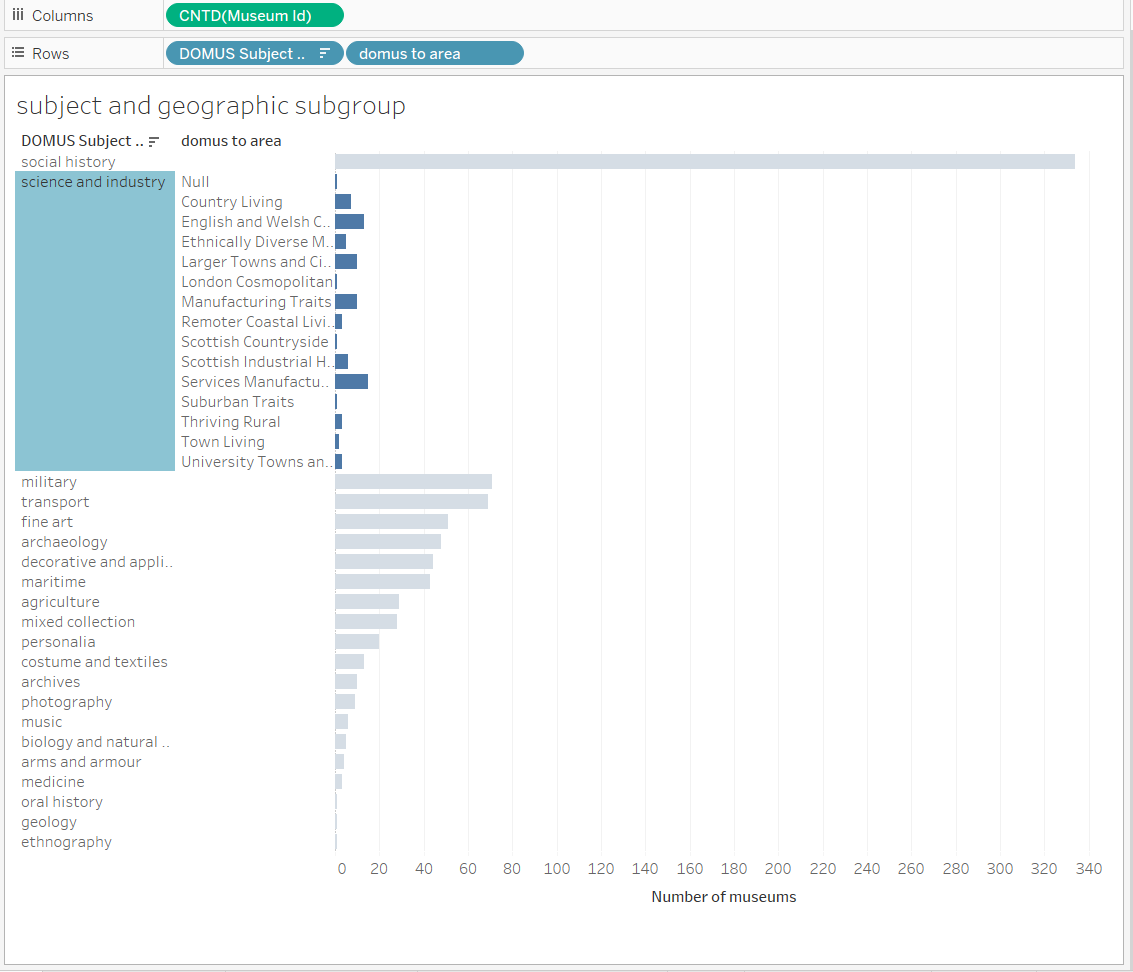
Time to build charts/dashboards:
The good and the bad:
So here's what went well managed to create a good plan, thoroughly researched the topic and came up with interesting questions to answer and provide analysis. Preparing the data went well.
The bad:
Once I got into tableau I got a bit stuck on what type of graphs to use to show my analysis as I was so keen to show different types of analysis.
Resources (Note to self: use these links for inspiration and guidance)
https://raw.githubusercontent.com/ft-interactive/chart-doctor/master/visual-vocabulary/poster.pnghttps://public.tableau.com/app/profile/andy.kriebel/viz/VisualVocabulary/VisualVocabulary
https://chart.guide/charts/chart-choosing/
https://datavizcatalogue.com/
https://public.tableau.com/app/profile/kevin.flerlage/viz/TheTableauChartCatalog/TableauChartExampleshttps://datavizproject.com/
http://visualizationuniverse.com/charts/http://www.tableaureferenceguide.com/