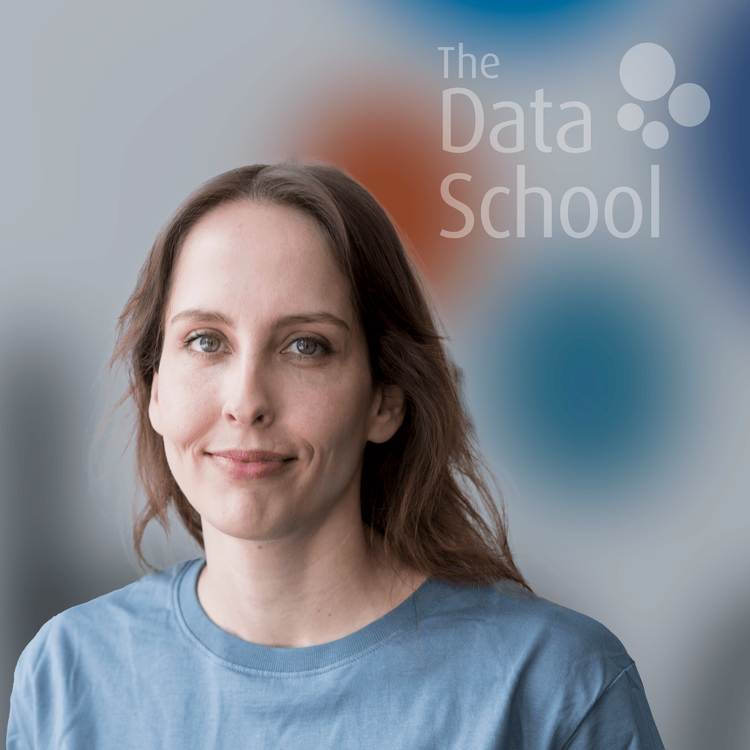
Franzi studied Integrated Design and worked as a freelance designer and photographer for many years before transitioning her career into the field of data analytics. Her passion for visual storytelling seamlessly complements her analytical skills and keen eye for detail. She excels in discovering patterns, exploring creative solutions, and leveraging her design expertise to present data in an engaging and understandable manner.
She is proficiently working with Tableau, Alteryx, Power BI & the Adobe Creative Suite (among others). She also has some programming knowledge in SQL, R, Python & HTML.
Franzi brings a diverse range of knowledge in design thinking, communications, branding, marketing, and business operations. As a longtime freelancer, she is used to self-organizing her work and always staying on top of client communications.
In addition to her creative pursuits, she has accumulated several years of experience in various retail and service-oriented part-time roles, gaining valuable domain expertise in industries such as fitness and custom furniture.
She brings lots of curiosity and empathy to her work. Her motivation comes from wanting to understand the world, one piece of data at a time. Franzi likes to work in many different fields because she loves to learn new things and experience new perspectives. Data Analysis is like investigating or solving puzzles, which is something she loves to do.
During her free time, she also enjoys painting, playing improvisational theater, reading, gaming, hiking, and traveling - especially for rock or K-pop concerts.
Skills
Data Visualization: Tableau, Power BI
Data Preparation & Cleaning: Alteryx, Tableau Prep
Programming: SQL, R (Tidyverse), Python (Pandas), HTML
Design: Adobe Photoshop, InDesign, Illustrator, Lightroom, CAD
Key Competencies:
Storytelling
UI / UX Design
Analytical Thinking
Attention to Detail
Documentation
Fast Learner
Improvisation
Long-Term Assignment
Energy Sector
Worked across multiple departments, delivering data-driven solutions that enable teams and leadership to make informed decisions. Led projects in a variety of initiatives, including:
Executive & Strategic Dashboards: Developing BI solutions that provide leadership with a clear, consolidated view of key performance indicators and progress toward strategic goals.
Operational Reporting & Monitoring: Building dashboards and automated reporting tools to track operational performance, detect issues early, and improve efficiency across departments.
Process Improvement & Analytics: Analyzing workflows and business processes to identify bottlenecks, optimize efficiency, and support data-informed decision-making.
Revenue & Performance Tracking: Collaborating with finance, sales, and operational teams to monitor performance metrics and support business outcomes.
Team Enablement & Knowledge Sharing: Mentoring colleagues in analytics best practices, dashboard design, and data workflows to strengthen the organization’s data capabilities.
Throughout the whole placement: partnered with teams from operations, finance, accounting, HR, technical management, and executive leadership, helping to support the company’s strategic initiatives.
SiB & Other Projects
Logistics Company
Helped build an Alteryx workflow to compare container movement to actual billable transport routes, using spatial data.
Built a Tableau dashboard visualizing the most frequented container routes, movements, and the most frequented locations in several countries.
Cosmetics Company
Built a Tableau dashboard to provide an overview of the company's marketing strategy for coupon codes and free gifts. The dashboard is intended for use by a marketing manager to track which strategies are performing well and generating the most ROI.
Data Community Challenge Tracker
Built a Tableau dashboard to visualize challenges for a famous data community project. Collaborated with a colleague to create an overview dashboard for participants to obtain more information about the challenges, track difficulty levels and participation, and easily navigate to each challenge on the corresponding website.
Finance
Re-engineered a Board-level MIS dashboard for an international bank, replacing dense tables with strategic KPIs and intuitive charts. Advanced a new Corporate Design-approved template that will be the new standard for executive reporting.
Experience before Data School
Professional Qualification: Gestaltungstechnischer Assistent für Medien / Kommunikation (2 years)
Studies: Integrated Design (4 years)
Freelance: Portrait & Documentary Photography, Graphic Design, Web Design (~10 years)
Google Data Analytics Professional Certificate
