


As 2022 comes to an end, I’d like to end with a blog post reflecting on how I’ve gotten here.
At the beginning of this year, I applied to the Data Analyst Training Accelerator (DATA), a program I’d applied to in past years. This year, I got in.
It was my first exposure to formal education in data analytics and the first time I’d ever heard of Tableau. Yesterday, I took and passed the Tableau Data Analyst certification exam. While my world lately has been KPIs and business dashboards, I always want to remember to also have fun in Tableau.
Using some of what I’ve learned and my 🌈 imagination 🌈, I’ve created a combination of whimsy and viz. I DEFINITELY had fun making this (link to Tableau Public).
Below are parts of my process (please view the link above before I ruin the magic for you!).
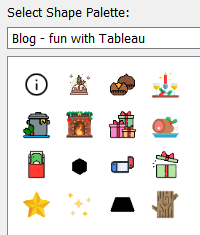
- I used a heavy amount of icons! The way that’s done is to have something on Shape in your Marks card, and to change the default icons to something fun. My favorite site for icons is flaticon.com.
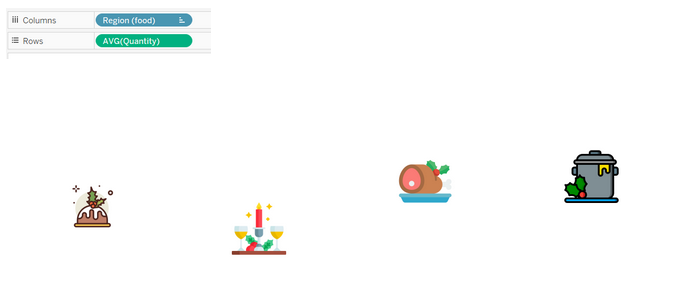
- Almost everything was made with dummy measures to get everything to align. But the dinner table and tree? Those were created using the Superstore dataset and look very wacky in sheet form.
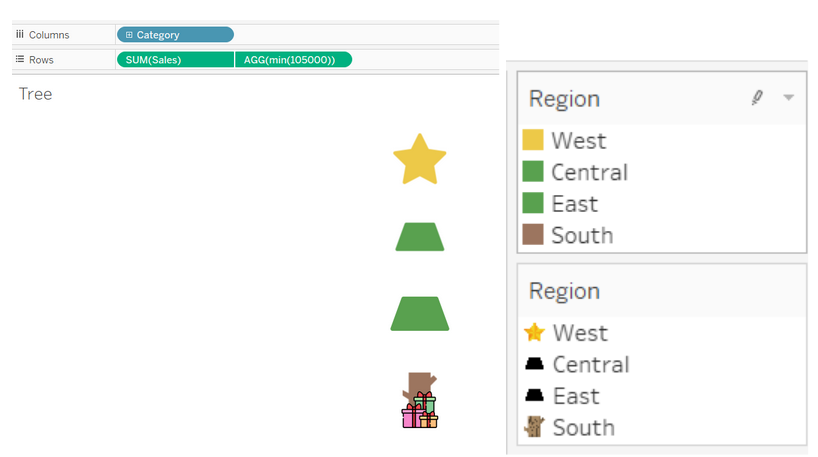
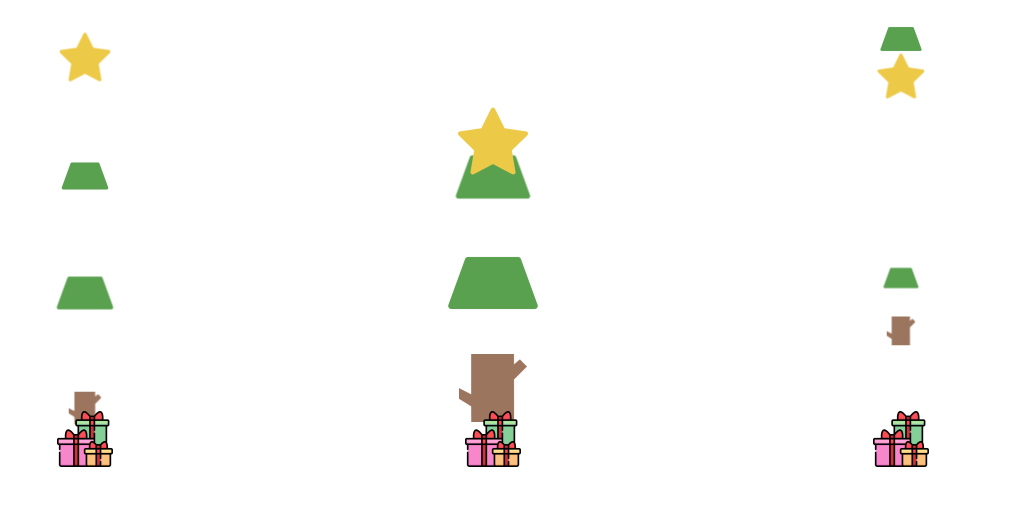
This is actually filtered to only furniture… Here’s what it looks like for other categories:
- Two of my favorite features in Tableau, parameter actions and dynamic zone visibility, do a lot of heavy lifting for opening presents, and showing just the selected one. Blog post on those to come!
I’ve loved this entire year of learning and growing, and there’s more to come! Hopefully next year’s iteration of this project can be even more complicated. 😉
🎇 Happy New Year and here’s to 2023! 🎆
Datasets Used
Icons Used
- https://www.flaticon.com/free-icon/trapezoid_7005656?term=trapezoid&page=1&position=6&origin=search&related_id=7005656
- https://www.flaticon.com/free-icon/trunk_408026?term=tree+trunk&page=1&position=2&origin=search&related_id=408026
- https://www.flaticon.com/free-icon/star_477406?term=star&page=1&position=10&origin=search&related_id=477406
- https://www.flaticon.com/free-icon/trapezoid_7005656?term=trapezoid&page=1&position=6&origin=search&related_id=7005656
- https://www.flaticon.com/free-icon/gift_3835818?term=presents&page=1&position=17&origin=search&related_id=3835818
- https://www.flaticon.com/free-icon/fireplace_2299170?term=fireplace&page=1&position=1&origin=search&related_id=2299170
- https://www.flaticon.com/free-icon/chestnut_5235157?term=chestnut&page=1&position=5&origin=search&related_id=5235157
- https://www.flaticon.com/free-icon/nintendo-switch_2331347?term=nintendo+switch&page=1&position=14&origin=search&related_id=2331347
- https://www.flaticon.com/free-icon/gift_3837100?term=open+present&page=1&position=40&origin=search&related_id=3837100
- https://www.flaticon.com/free-icon/hongbao_6643631?term=hongbao&page=1&position=4&origin=search&related_id=6643631
- https://www.flaticon.com/free-icon/cake_2358107?term=christmas+dinner&page=1&position=18&origin=search&related_id=2358107
- https://www.flaticon.com/free-icon/cooking-pot_6293135?term=christmas+dinner&page=1&position=60&origin=search&related_id=6293135
- https://www.flaticon.com/free-icon/ham_6293026