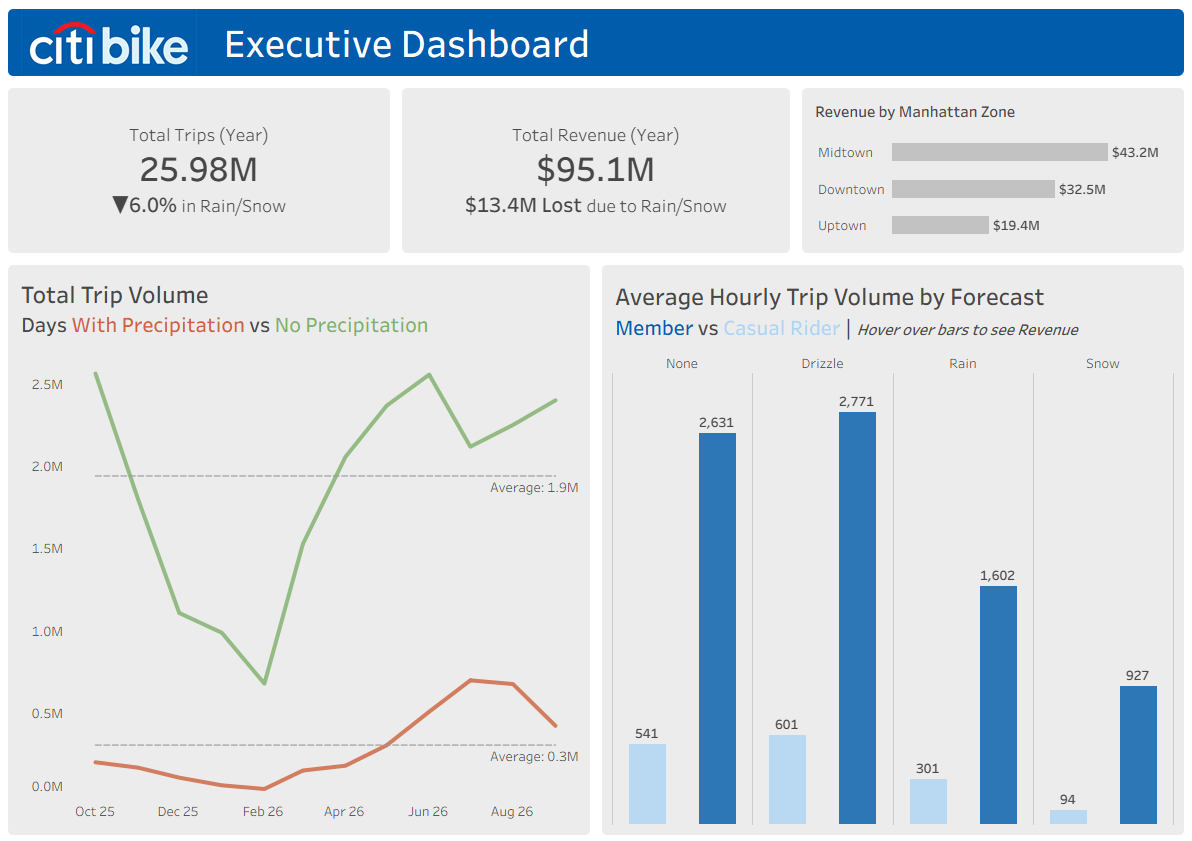
Over the past week, I set out to build an end-to-end data pipeline connecting Open-Meteo weather forecasts with over 40 million Citi Bike records. The goal was to answer two main core stakeholder questions:
- For the Citi Bike CFO: Quantify total revenue and ride volume shortfalls when storms hit NYC, broken down by rider type.
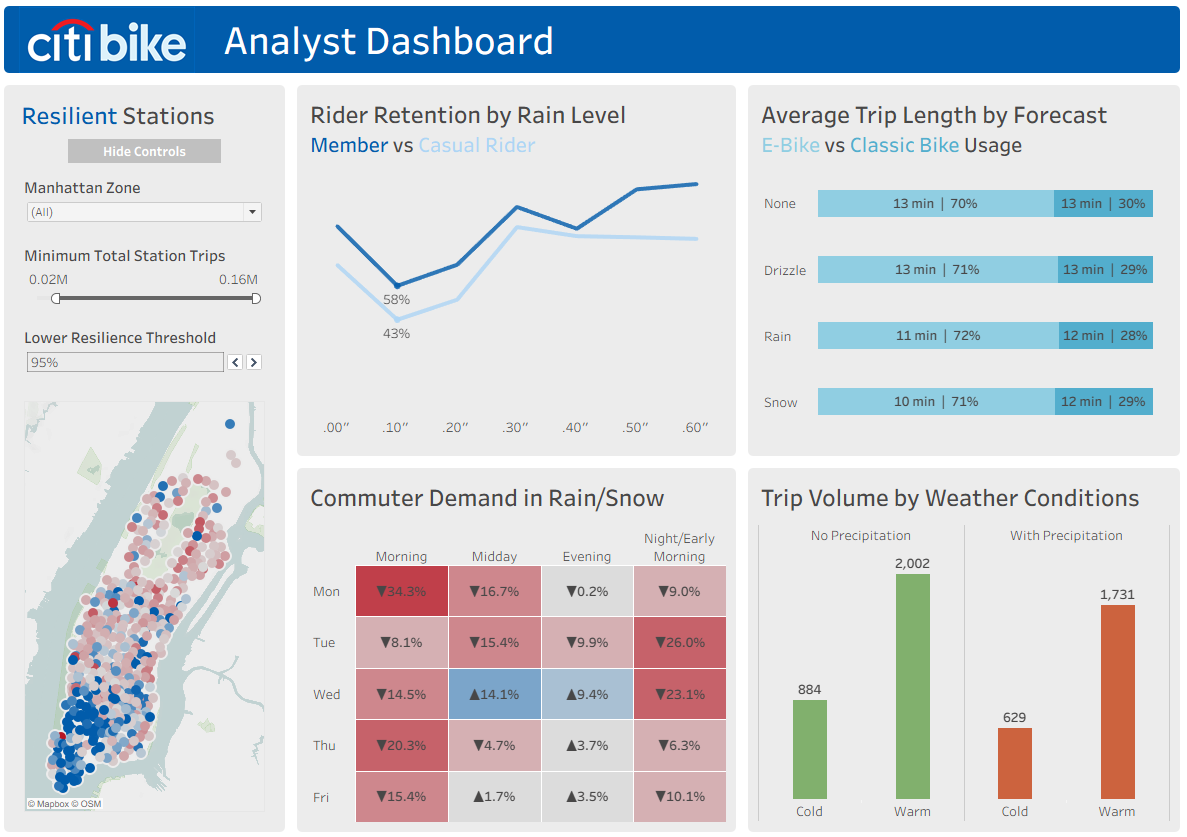
- For the Operations Analyst: Determine where ridership collapses versus where it holds resilient, when casual riders pull back, and how rain shifts commute patterns.
Looking back across the five days—from API extracts and Snowflake schemas to LOD tuning in Tableau—the final dashboards delivered clear operational insights.
Here is what the project uncovered, followed by what I would do differently with the benefit of hindsight.
What the Data Showed
- Casual riders need nice weather: At the first trace of measurable rain (0.05", casual demand drops sharply to 43% of baseline. Stations around recreational hubs like Central Park tend to have lower rain-resilience.
- Members demonstrate commuter resilience: While members also pull back at the first sign of rain (retaining 58%), they hold significantly higher resilience throughout the week. Unsurprisingly, rain affects morning commute periods more than evening ones, meaning that people are less willing to get wet (either on foot or bike) on their way to work.
- Rain matters, but cold compounds: In warm weather, precipitation reduces average hourly volume from ~2,002 trips to ~1,731 trips—a visible dent, but riders still push through. In cold conditions (
<45°F), wet trips drop to just 629 trips/hour. Cold plus rain freeze people's desire to ride bikes.
Technical Roadblocks & Analytic Breakthroughs
The Level of Detail (LOD) Trap
One of the most valuable technical challenges this week came from calculating hourly baselines. Early on, un-nested LODs caused fragmented row-level slices to dilute the dry hourly baseline, while a handful of rainy rush-hour periods caused artificial spikes.
Nesting the LOD—grouping by station, hour of day, and condition before aggregating—was essential to stabilize the baseline and isolate actual weather trends from daily commute rhythms.
The Low-Sample Tail Distortion
When plotting ridership against granular 0.05" precipitation bins, an unexpected trend emerged: past 0.35" of rain, normalized demand appeared to bizarrely surge toward ~3,800 rides/hour.
The cause was sample size bias. Extreme torrential downpours (>0.35"/hr) occurred only a handful of times all year, and they happened to strike directly during peak weekday evening rush hours. The surge wasn't a sudden rider enthusiasm for heavy rain—it was the underlying commute volume overpowering the tiny denominator of wet hours.
In Hindsight: What I Would Do Differently
Looking back with the benefit of hindsight, three key adjustments would strengthen the next iteration:
Test Spatial Boundaries in Alteryx First
To isolate Manhattan, I relied on station coordinate filters. In hindsight, I should have used Alteryx’s native spatial and map tools early on. Plotting station coordinates against an interactive Alteryx map tool before writing to the database would have cleanly eliminated border leakage and dock anomalies without needing manual exclusions downstream in Tableau.
Run Comprehensive Data Integrity Checks Before Exporting
Midway through dashboard construction on Wednesday, I discovered a gap: missing rows for April. While fixable via a backfill workflow, it reinforced the fact that I should have thoroughly validated and tested the full dataset before exporting from Alteryx to Snowflake. Running date-completeness checks, counting distinct months, and establishing row-count assertions prior to warehouse ingestion would have caught the missing month upfront and prevented backfilling downstream.
Final Thoughts
This project reinforced that successful data analysis & visualization isn't just about showing what went right—it's about rigorously validating anomalies when the data shows something counterintuitive.
Thanks for following along! Here's what my finished dashboards looked like: