


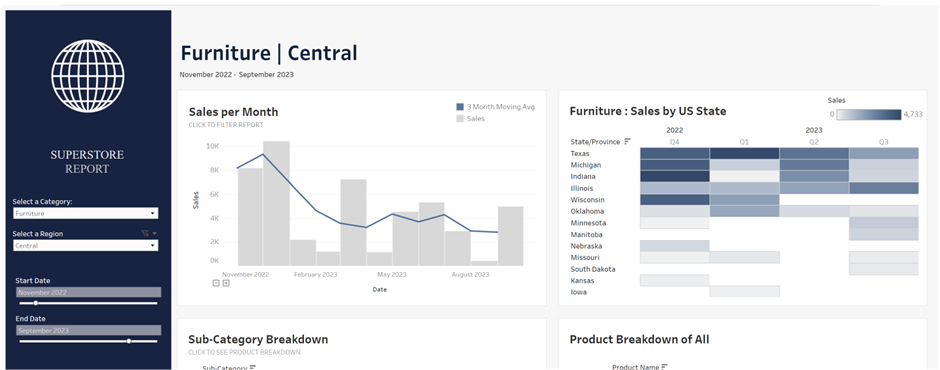
Often, it is the case that as you switch between different locations, categories, or filter to a specific date range for a Tableau dashboard, it can be very useful for chart titles, or the overall title to change along with it.
For example, in the dashboard below, the main title changes to the filtered region and category in the left-hand pane.
For example:

To be able to insert a title that changes dynamically with the filter, start by creating a new sheet and add in the categories you would like to be in the main title by clicking and dropping them into the labels in the marks pane.
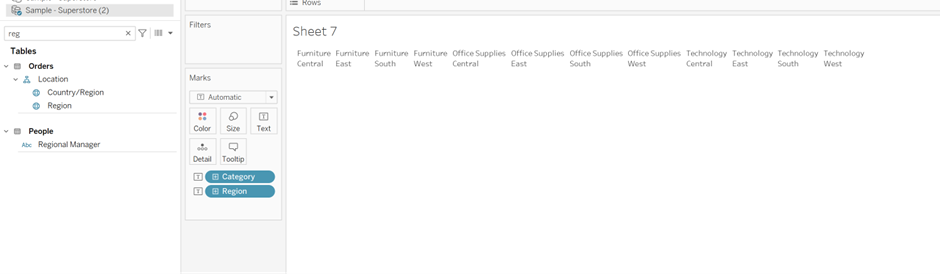
Then remove the title (e.g., Sheet 7) by right-clicking on the title and select "Hide Title." Next, add the same categories to your filters pane like so:
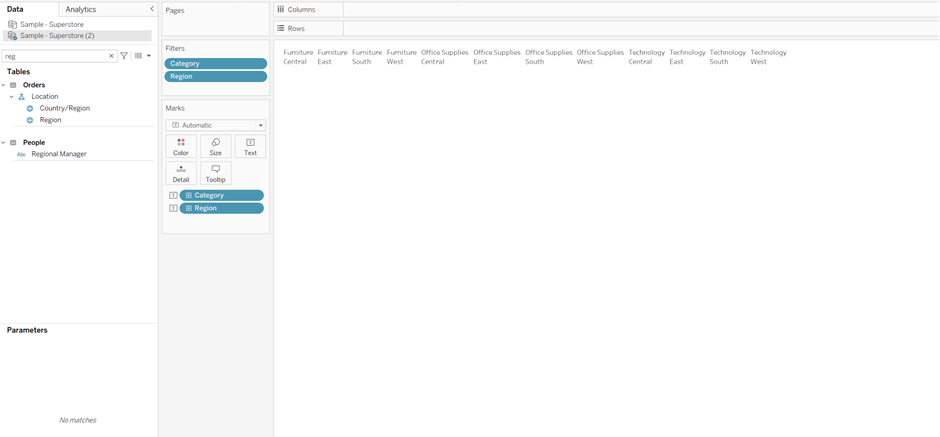
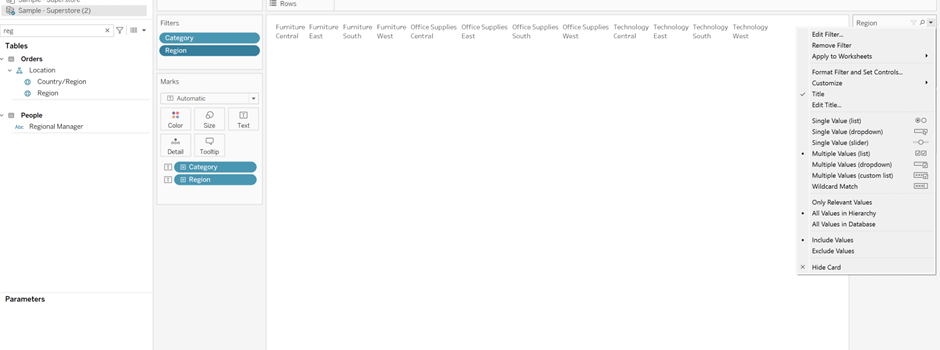
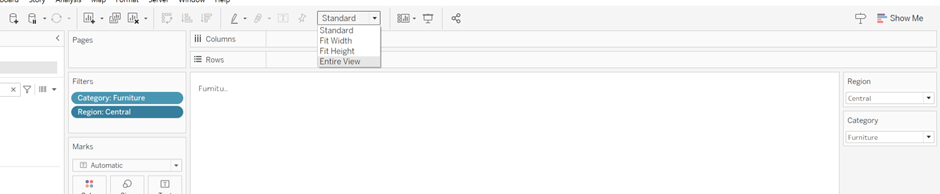
Select "Show Filters" by right-clicking on them in the filters pane and select "Show Filters." When they appear on the right-hand side, click the dropdown in the top right corner, and you will be able to edit the filters. In this case, I am using a Single Value (Drop Down). By doing so, it will automatically filter your results to the single values; then select 'Entire View.'
You can then format your title by clicking on 'Label' in the Marks pane; then the ‘…’. A pop-up window will then appear.

I chose to increase the size to 28 and change the font to Tableau Bold, color changed to blue, and then added a separator. Then just hit apply and close the window.


Add this sheet as a title to your dashboard and show your filters by clicking on the arrow pointing down on the side of the sheet, select filters, and make sure both your filters are selected to be shown. Then there you have it, a dynamic title.