Day 3 has come and, like the snows of yesteryear, has passed as swiftly as the seasons...
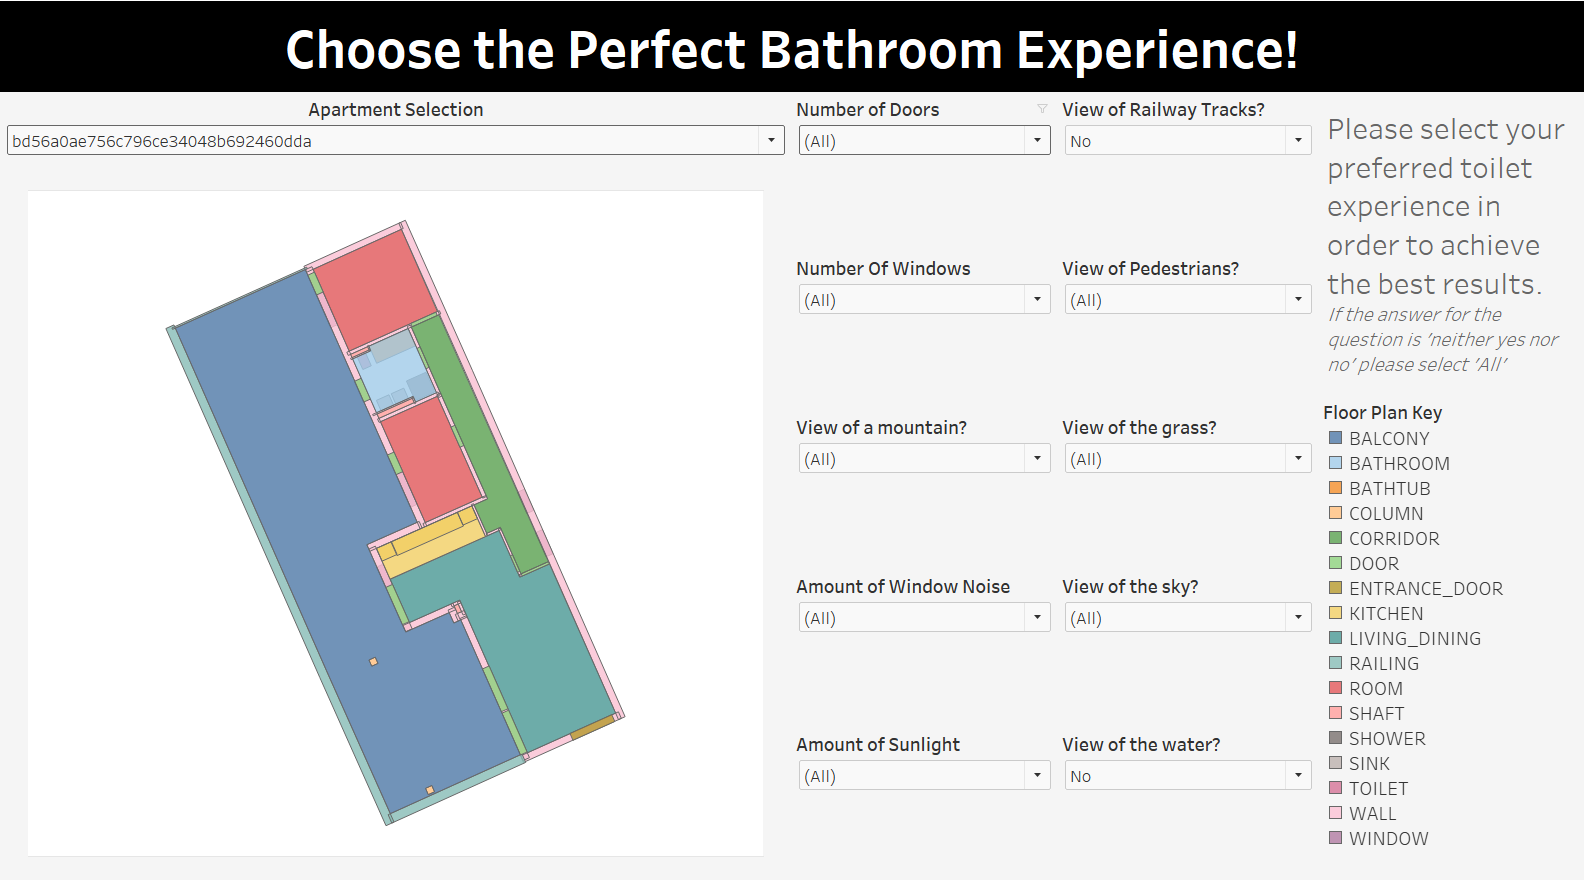
The dataset given to us (source: https://zenodo.org/record/7215005#.Y33qK3bP3Eb) was large, and with this came its own set of issues: choosing a story. As the name suggests, information surrounding 'Swiss Dwellings' was broad. I chose to narrow this down by allowing the user to choose their own bespoke bathroom experience. Whether this ranged from the choice of a mountain in view from said bathroom to the amount of traffic noise available was up to the user.
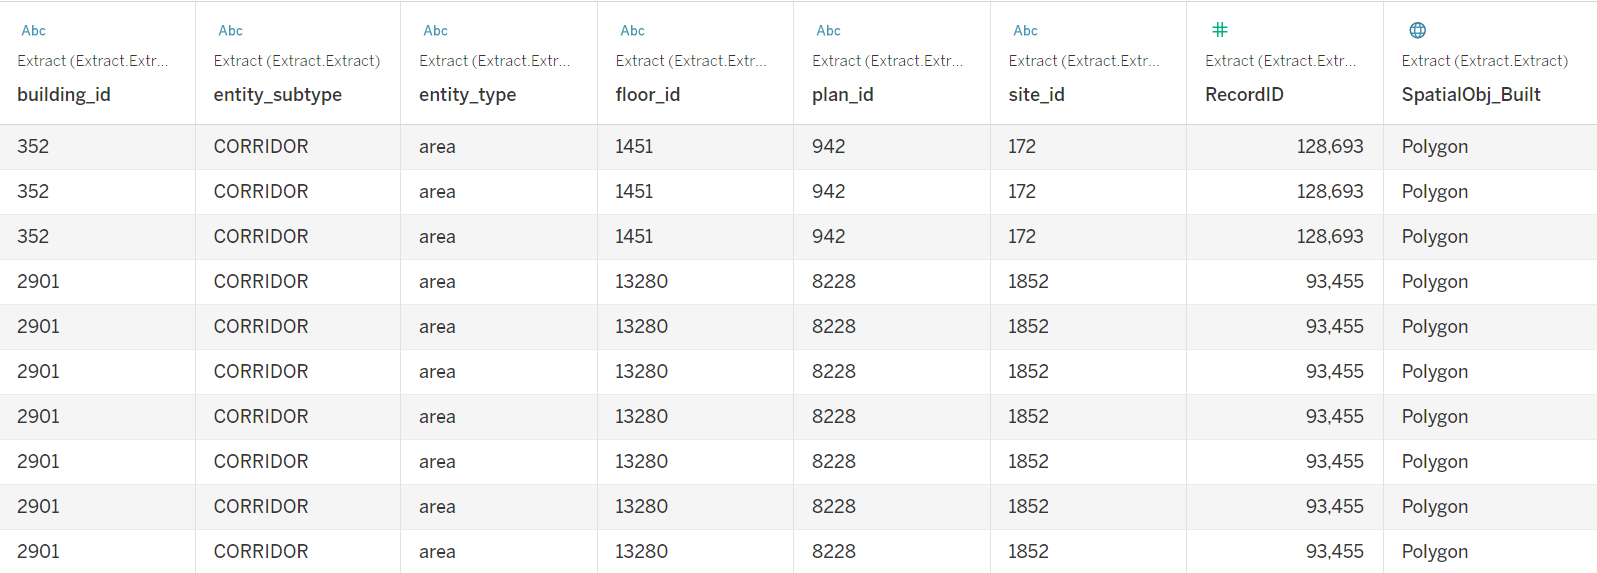
In procedural fashion I had to clean the data and reduce the amount of fields and rows within the dataset in order to maximise the efficiency of both the workflow in Alteryx, and workbook in Tableau.

The first workflow filtered the data based on a bathroom granularity. Thereby only including rooms which included a toilet and which were considered a 'Bathroom'.
The next then joined the set of apartments which included these rooms to created a floor plan of the entire apartment (I have since accidently saved over this workflow so only the result is included)
Next I aimed to then created a specific list of preferences for the user to pick their experience which filtered, and excluded, each apartment based on these preferences. I designed the view, however given the time constraints I was limited to making sure it was functional first. Therefore, while the design is fairly rudimentary, the result was as intended.