So at the beginning of the week I discovered this visualisation from a university friend now working as a sports analyst over in America.
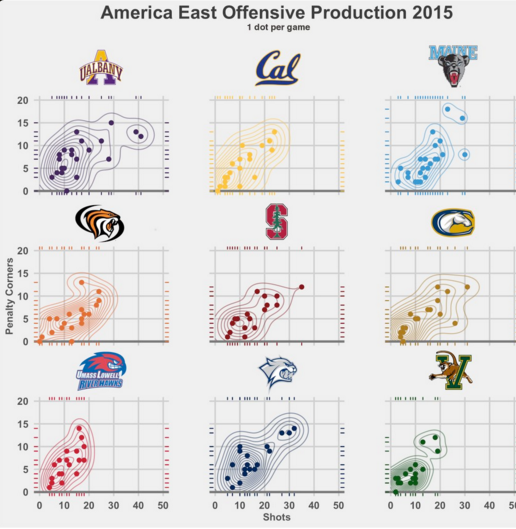
Viz courtesy of Chris Fry (@ChrisAFry).
To me this is a beautifully simple piece which I instantly wanted to recreate in Tableau and knew I would also need alteryx to do so as well. Quite early on I knew this wasn’t going to be the most simple project I will have attempted.
First of all why do I like this visualisation so much?
I love the use of colour, the logos and the typeface used. I also love the use of the contour lines. People are notoriously bad at understanding correlation graphs. Just try out this neat online game that Jeffrey Shaffer posted a couple of weeks back and you will realise. These contour lines are designed to help aid the interpretation of the correlation. It’s a simple premise…the closer the contour lines, the more consistent the data.
This visualisation was in fact made using t he R programming language, specifically using the functions available in the GGPlot2 package.
What I thought was wise at this point to aid my understanding of the graph (before even attempting to make this in alteryx and Tableau) was to recreate this chart in R myself.
One problem with this though, I have never used R and have very limited experience with any programming languages.
I’m going to use this first blog to show 7 things I learnt in R, specifically the R Studio platform…
Tip 1: the flashing cursor indicates which panel is ‘active’
Tip 2: You can write simple math in the ‘console’ pane
Tip 3: By using the ‘=’ or ‘<-‘ syntax we can assign values to variables
Tip 4: Variables are case sensitive (so we can assign different values to b and B)

Tip 5: Mode(variable) will return the data type
Tip 6: By using the options(“digits”=x) we can change the number of significant figures values are returned as
Tip 7: We can clean our environment window by clicking the ‘paintbrush’ looking icon in this pane.
Thanks for reading, and I hope this blog proves useful to R-newbies.
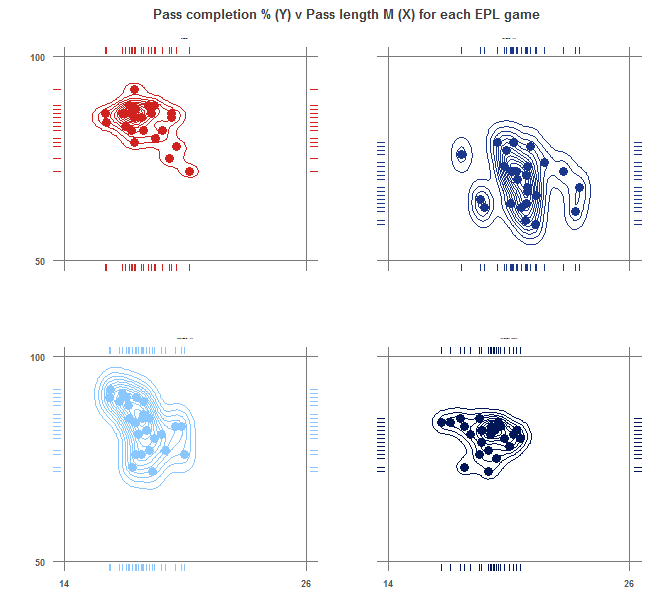
After just a few hours of R-time I managed to create the below viz, which at some point this week I plan to blog on how I did this.
Ben
#VizLikeAnRRRRRRRRRRRtist