Todays task was a tricky one. After the Brexit referendum the current cohort DS 3 had to build dashbaords related to the Brexit. This was our task for this day aswell. We had to find survey data (somewhere in the internet) from a point of view before and after the Brexit to compare moods or expectations in the society. The task wasn't that easy because a lot of surveys are not downloadable or its just plain text which isn't that helpful. SO a lot of time took the search for good datasets.
At the end I decided to look on the british optimism. I thought it might be interesting how the Britons look into their future and are they more optimistic or pessimistic. I found 2 datasets which were not exactly comparable, but I did my best.
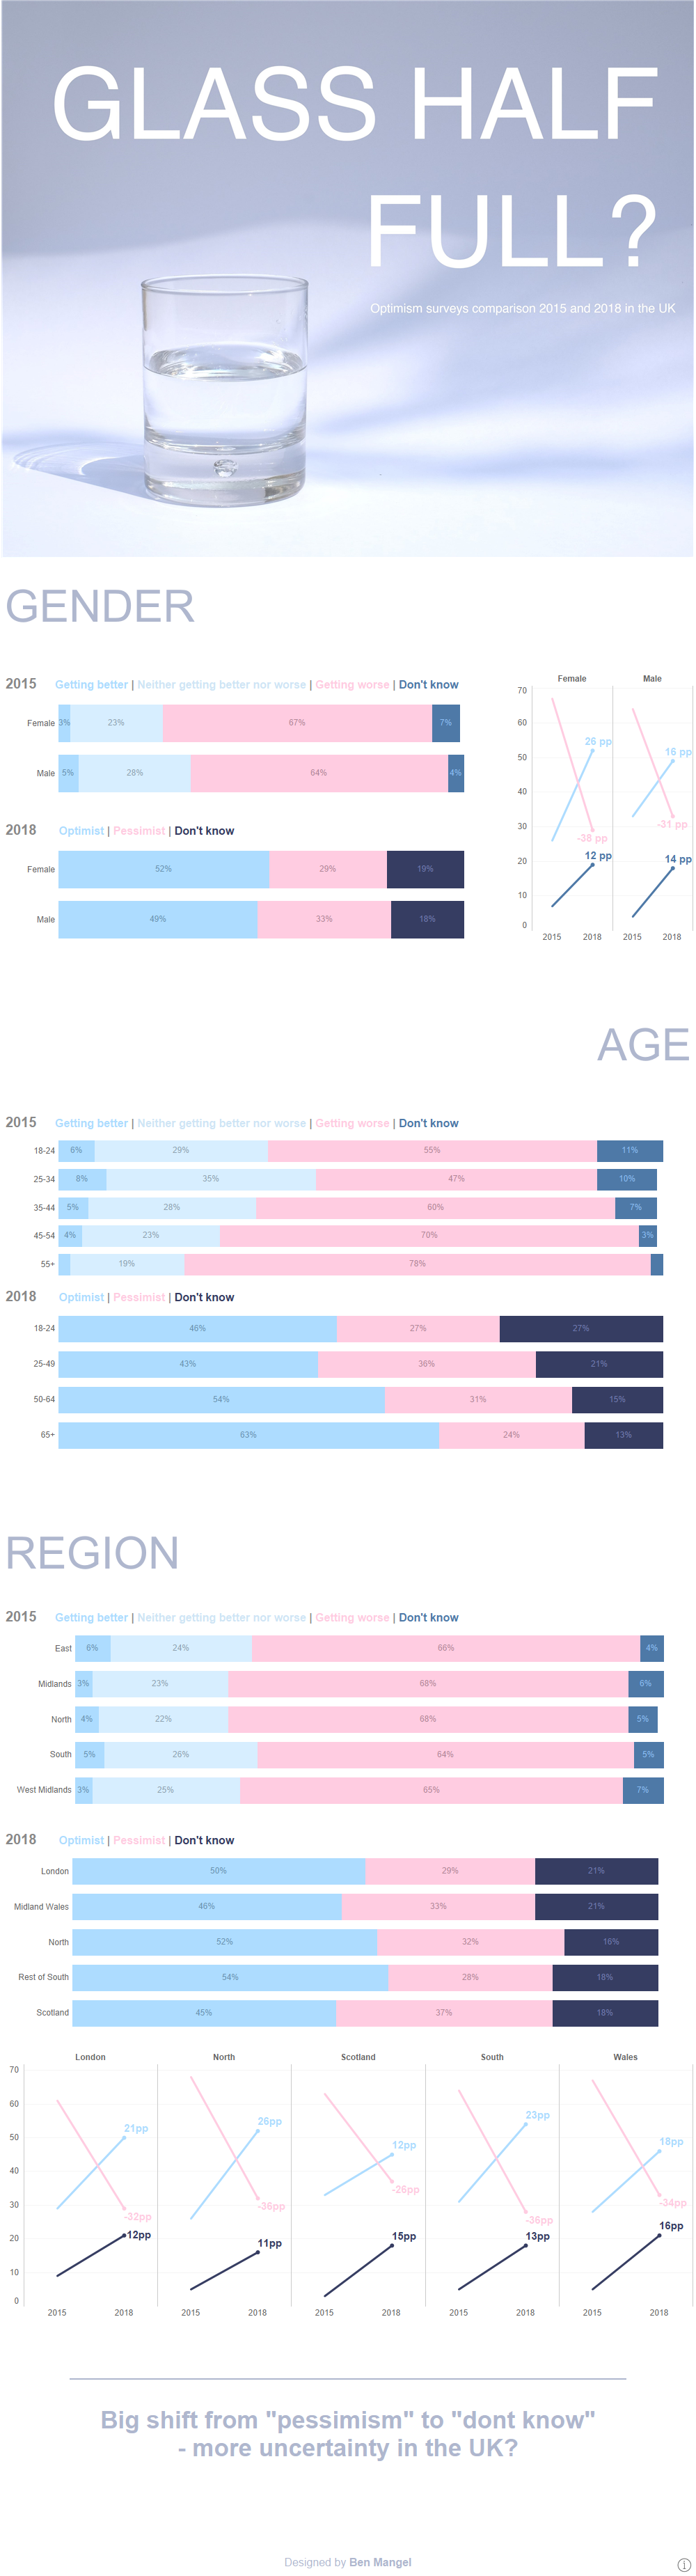
I tried to compare the surveys in it's breakdowns: Gender, Age and Regions. As a vizualisation type I chose a Likert Chart and a slope chart. And guess what? THe Britons are way more optimistic when you compare 2018 vs 2015. Maybe this is beacause of the differences in the surveys but maybe this has other reason.
My dashbaord looks at the end like this: