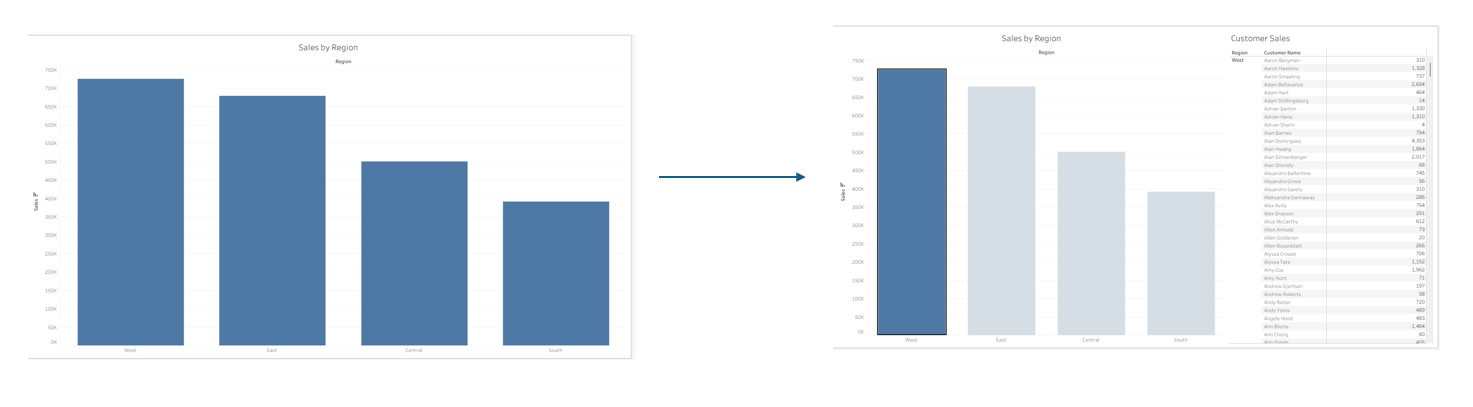
Dynamic Zone Visibility in Tableau allows you to show or hide dashboard elements dynamically based on user interaction, eliminating cluttered containers and complex sheet-swapping hacks. Here is a walkthrough using a basic example with the superstore dataset to construct a dynamic drill-down dashboard that reveals detailed customer sales only when a region is selected.
1. Create the Calculation and Parameter
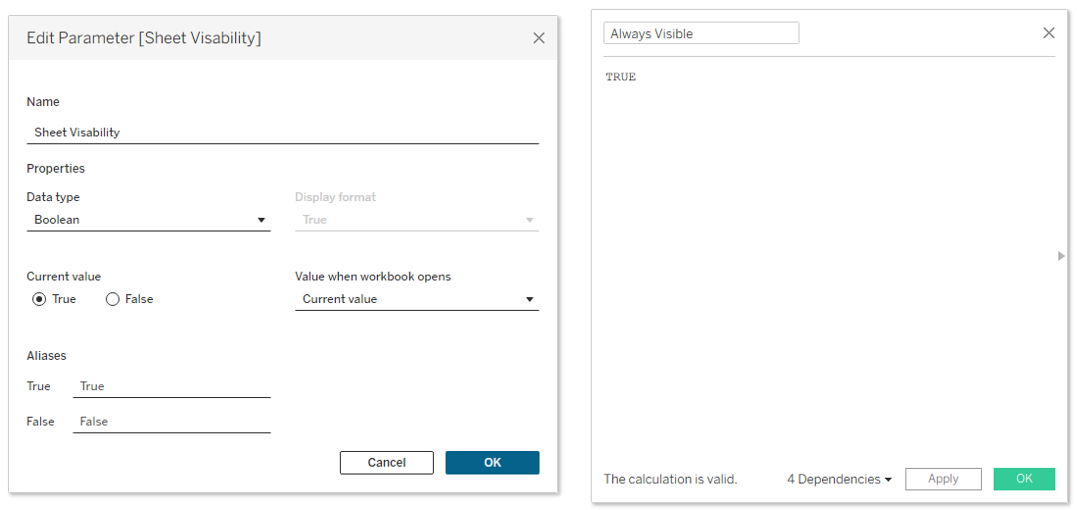
- Boolean Parameter: Create a parameter named
Sheet Visibilitywith a boolean data type (true/false). - Calculated Field: Create a calculated field named
Always Visiblewith the static formulaTRUE.
2. Build the Core Worksheets
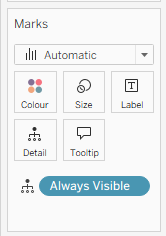
- Sheet 1 (Sales by Region): For your sheet you want to stay visible place your
Always Visiblefield onto the details mark. - Sheet 2 (Customer Sales Table): For your second sheet you don't need to do anything special.
3. Apply Dynamic Zone Visibility on the Dashboard
- Combine
Sheet 1andSheet 2onto a dashboard. - Select
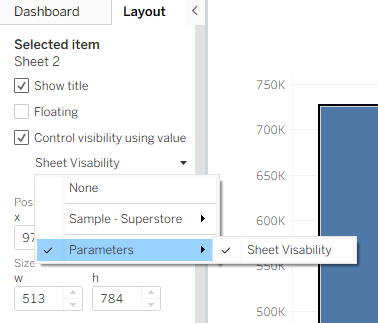
Sheet 2on the dashboard canvas and open the Layout tab on the left panel. - Check the box labelled Control zone visibility using value.
- Choose
Sheet Visibilityfrom the dropdown list as the controlling parameter.
4. Wire Up Dashboard Actions
- Parameter Action: Go to Dashboard > Actions and add a Change Parameter action. Set the source sheet to
Sheet 1on Select. Target theSheet Visibilityparameter using theAlways Visiblesource field. Under Clearing the selection, set the option to Set value to and selectFalse. - Filter Action: Add a Filter action that targets
Sheet 2usingSheet 1as the source.
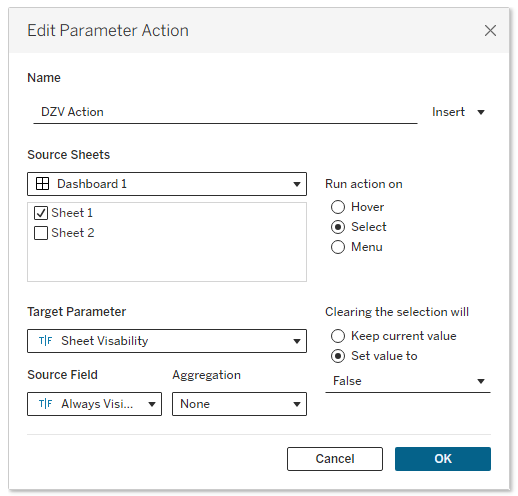
How It Operates Clicking any bar on our Sheet 1 view triggers the parameter action, setting Sheet Visibility to True and making the Sheet 2 pane appear while simultaneously filtering it to the chosen region. Deselecting the bar resets the parameter to False, causing the detailed view to collapse seamlessly.