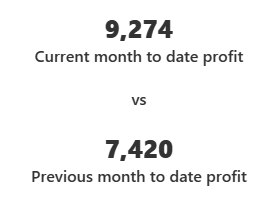
Date comparison KPIs are a great way to show increase/decrease in performance overtime in a quick concise manner. These KPI's could be used alongside a line chart to give a summary of growth between two dates. For example, you might have a line chart showing the trend in profit from sales over 5 years, but you only want to see the difference between the profit made between last month and now, and the start of the month and this time last month (i.e 1st September --> 23rd September and 1st August – > 23rd August). This situation will require a Month-To-Date (MTD) calculations.
Step 1: Current month sales
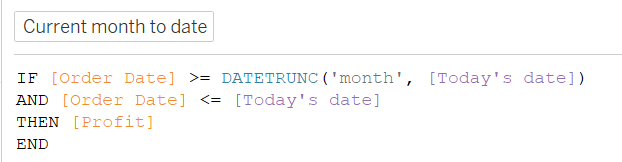
Shown above is a calculated field which calculates how much profit has been made between the start of the month to your current day.
The first line of the calculation checks order date field for all the dates greater than or equals to the start of the month. The DATETRUNC function works by "truncating" a date to a specific level of detail, like year, month, week, or day. It essentially resets the specified unit of time to their starting point. The function created specifies 'month', which means its looking at the first day in the month.

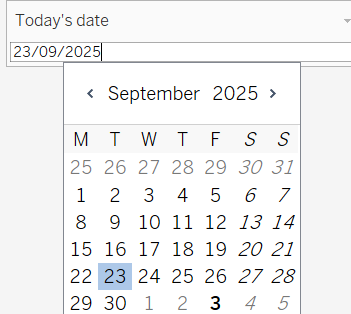
It employs a "Today's parameter" in the part which requires a date, which allows the user to define what the current date is.
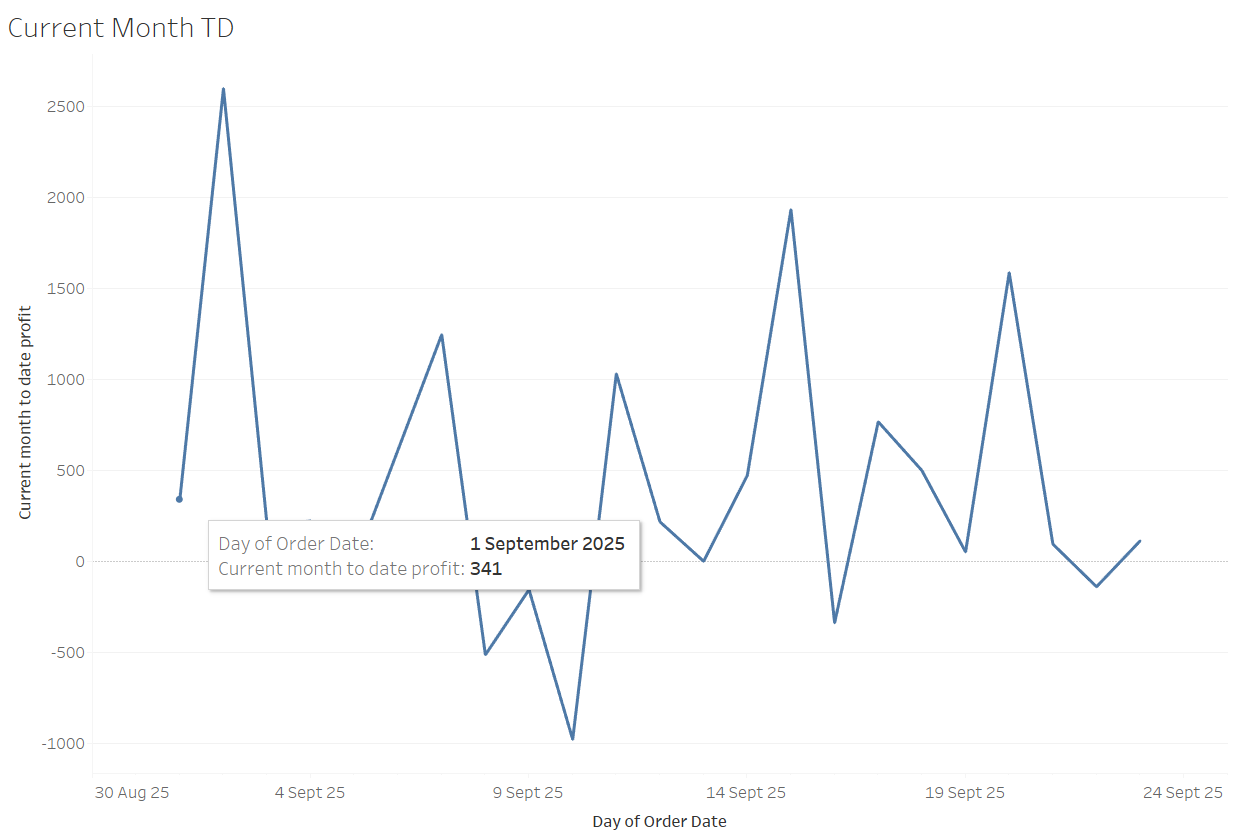
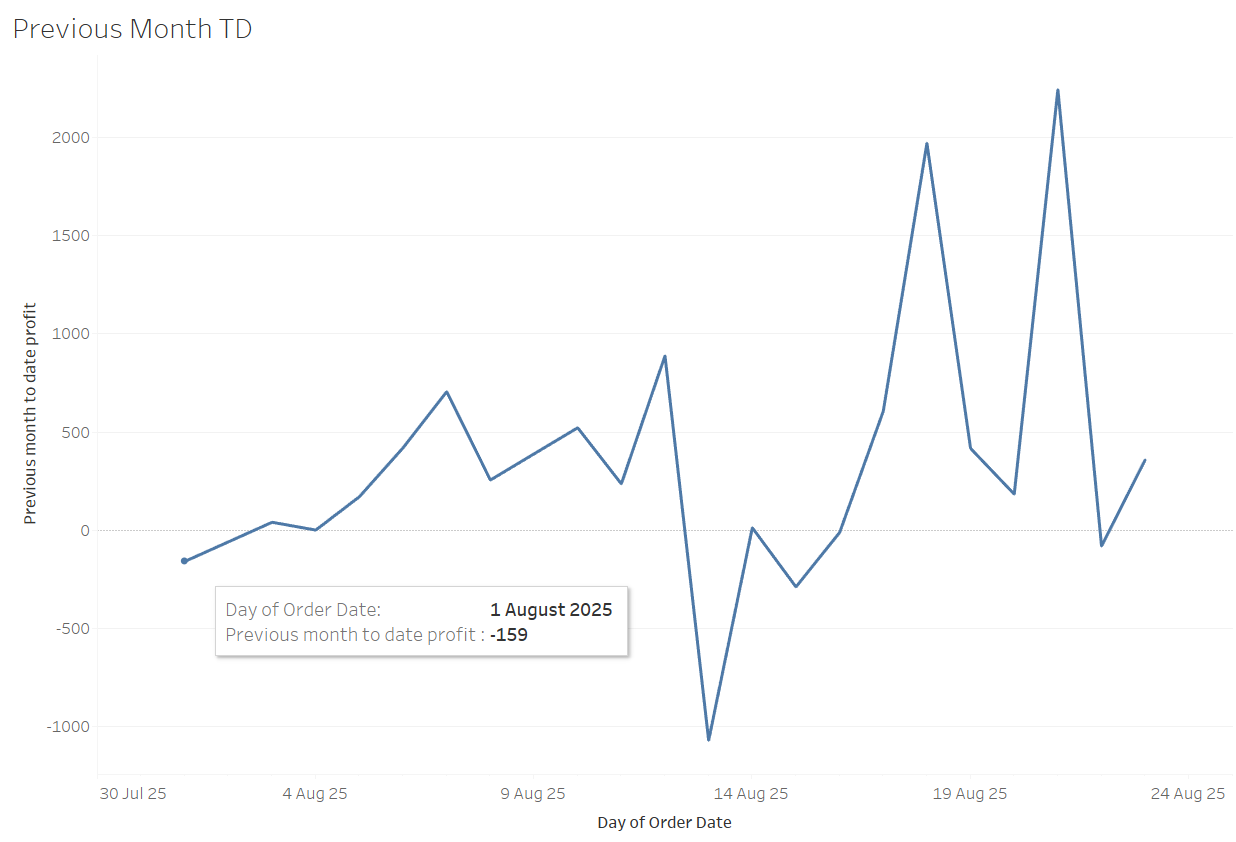
The second condition in the IF statement checks the order date field again to see all the dates before your 'todays date', and finally returns the profit of all dates which match the condition. You can create a line chart to make sure you are checking between your desired range.
Step 2: Previous month sales
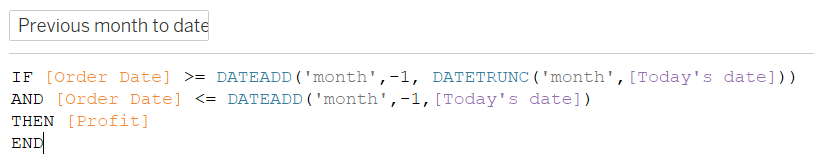
Shown above is a calculated field which calculates how much profit has been made between the start of the previous month to your current day in the previous month.
Similar to the current month calculation, its first condition uses a DATETRUNC function to truncate the month to the first day. This DATETRUNC function is then used inside a DATEADD function which is used to add(subtract) time from a date unit, in this case we are subtracting 1 month from the 1st day of of the month you're currently in.

The second condition in the IF statement, checks the order date field for all the dates on or before a month a go from your previous date. Then finally, the function returns your profits for all the dates within that range.
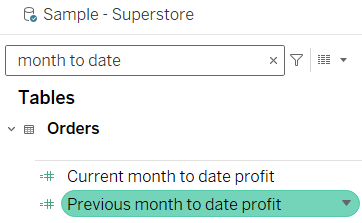
Step 3: Creating the KPI
Now to the important stuff, putting these calculations onto your sheet. Once you've created these calculations, they should appear on your data pane as measures.
Drag both pills unto your Text mark card to display them on the sheet. Now all you have to is format the texts from the text icon on the marks card.