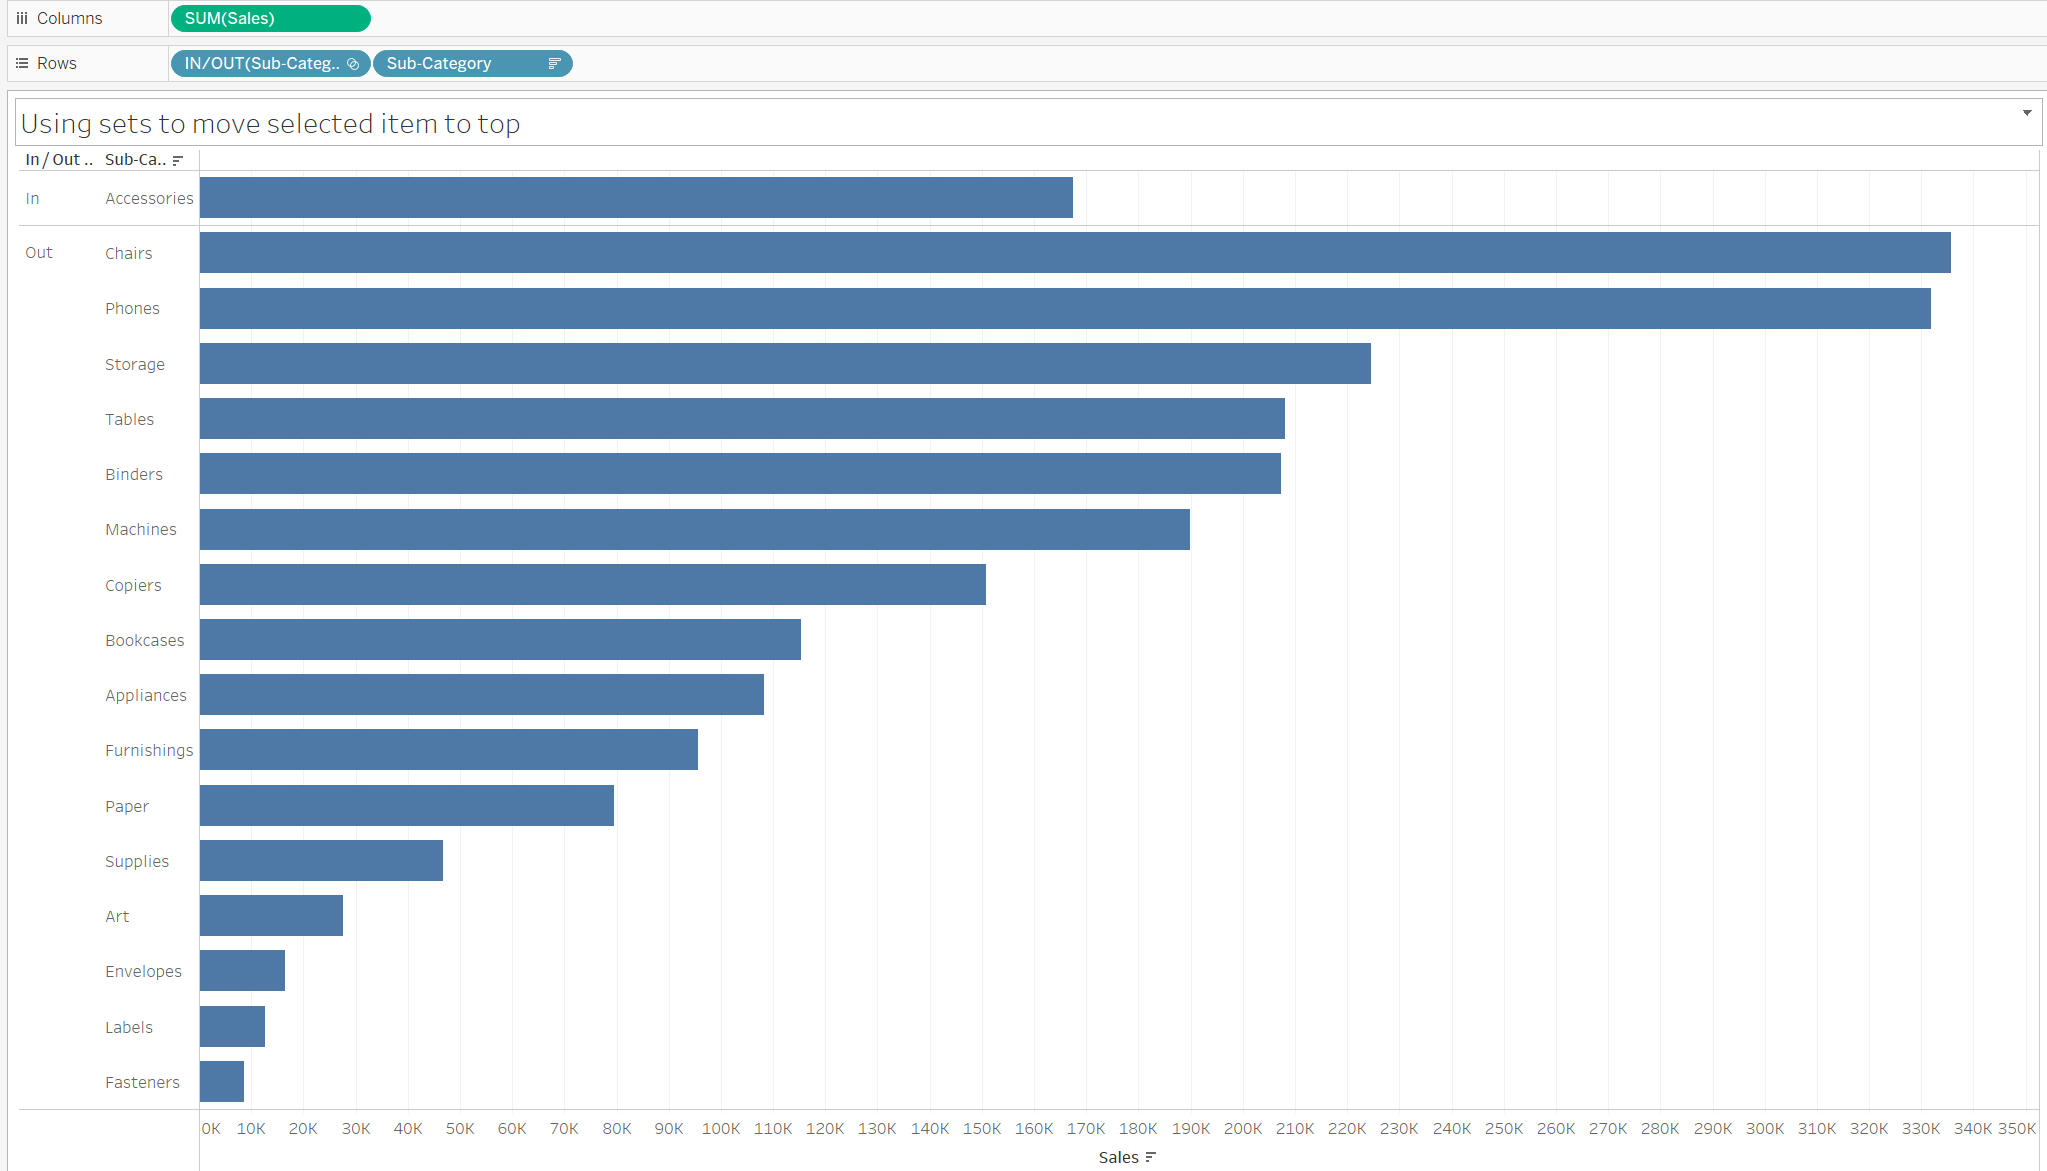
When building charts, its important to think about what the end user should focus on. Using pre-attentive attributes such as colour, shape and size would help guide the user to a point of focus instantly. In addition to this, position can also be used to highlight a specific area to the user if used effectively.
A great use of position in visualisation is when you want to focus on the sales of a product sub-category, but when you sort the bar chart by ascending/descending, it always falls to the bottom. Tableau gives you the option to elevate this subcategory to the top of the chart, so it is highlighted amongst other categories. You can do this using sets or parameters, but this blog will use the sets method.
Step 1: Create your bar chart
Drag your dimension unto the columns shelf and your measure to the rows. For this demonstration, I will be looking at the sum of sales for sub categories.

Step 2: Create your set
Right click on sub-category dimension from your data pane and click the drop down on "create", then click set. In the Menu that opens up, stay in the generals tab and click one item of your choice from the list to add it to the set. Name the set and click "ok" without changing anything else.

Next you drag the set you created and add it to the left of the sub-category field on your rows shelf. Also make sure your you sort your chart in descending order.

The item in the set goes to the top of your list as it falls under "In" in the set you created.
Step 2: Create your set action
To make your set dynamic to allow you to click a different item to move it to the top you need to employ a set action. To do this, click on worksheet on the top left of your screen and click on actions. Then click on "Add Action", from the drop down click "Change Set Values". Name your set and set your source sheet to the sheet you're working on and set your target set to the set you created. Make your action run on "Select". Also you want it so that when you run the action, it will "assign values to set" and clearing it will "keep set values".

Now when you click on a bar, it should add it to your set and to the top of your bar chart. All you have to do now is right click on the set you created from the rows shelf and unselect " show header".

