


Imagine you own a lemonade stand and you're trying to figure out how many lemonades you sold yesterday, but your data is scattered everywhere. You have one list of every single sale, a separate list of all your customers and their emails, and another list of all the different lemonade flavours you sell. You can't just connect them all. This is the challenge of a relational database, where different pieces of information live in separate tables. Data modelling is the solution you need to build a clean, organised blueprint for your data, so you can easily analyse it.
The Three Stages of a Data Model
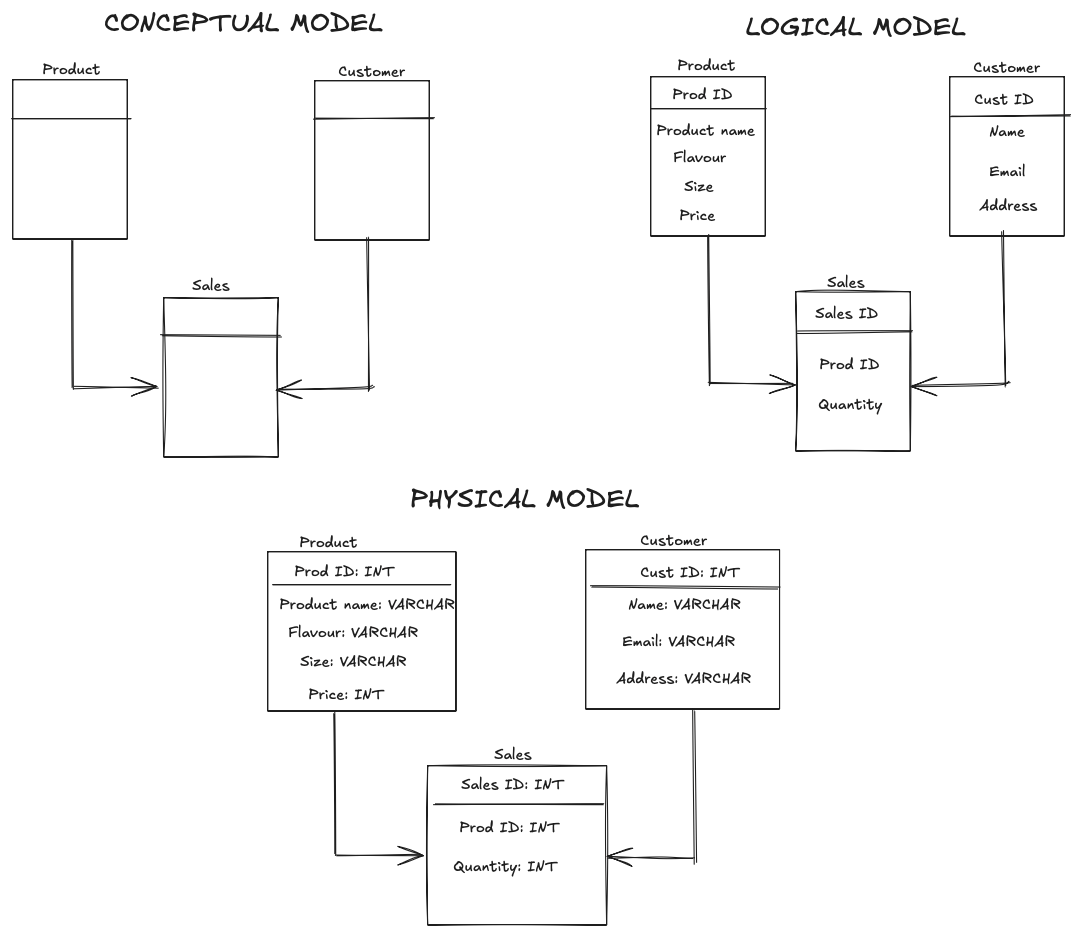
Just like a house has different plans (a sketch, an architect's drawing, and a construction plan), data modelling happens in three stages.
- Conceptual Model: This is the "big picture" view. It focuses on the core business concepts and their relationships, without getting into technical details. It's like a napkin sketch of your house, showing the kitchen and living room but not the specific plumbing.
- Logical Model: This is more detailed. It defines the specific data to be collected and the rules for how it relates to other data. It's the architect's drawing. In this stage, you'd specify your fact and dimension tables.
- Physical Model: This is the final blueprint, detailing exactly how the data will be stored in a database. It's the construction plan. This is where you finalise data types (e.g., text, numbers) and create the final tables.
Facts and Dimensions
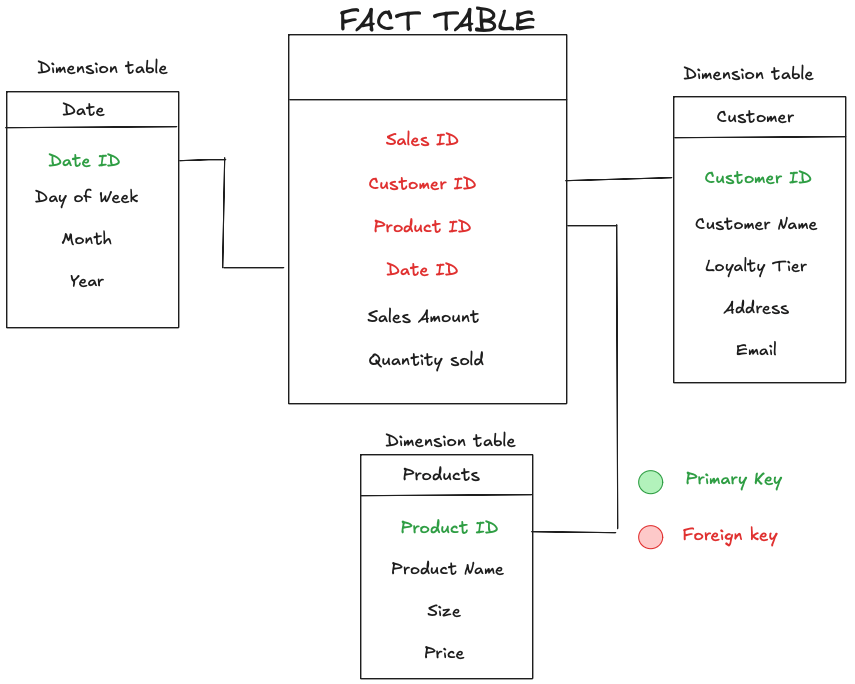
Think of your data in two ways: what you want to measure, and what you want to describe. This is the foundation of a star schema, the simplest and most common type of data model.
- Fact Tables: These are for the "what happened?" and "how much?" They're the core of your data model and hold the measurable, quantitative data that you can aggregate. For our lemonade stand, a fact table would contain the details of every single sale: the amount, the quantity sold, and the cost. Each row represents a specific event at its most basic level, a concept known as granularity.
- Dimension Tables: These are for the "who, what, where, and when." They provide the descriptive context for the facts. A dimension table would describe your customers (name, email), products (flavor, size, price), or the date of the sale (day of the week, month, year). Dimensions are the attributes you use to slice and dice your data.
Bringing It All Together
To connect your facts and dimensions, you need a few key pieces of information.
- Primary Key (PK): This is a unique identifier for each row in a table. Think of it as a person's fingerprint. Every row in your customers dimension table has a unique customer ID that identifies it.
- Foreign Key (FK): This is a primary key from a dimension table that's included in a fact table to create a link. For every sale in your sales fact table, you'd have the customer ID of the person who bought it. This customer ID is the foreign key that connects the sale to the customer's information.
- Relationships: The links you create between tables are called relationships. The most common in data modelling is a one-to-many relationship, where one row in a dimension table (e.g., one customer) can be connected to many rows in a fact table (e.g., many sales).
The power of a data model comes from connecting these tables with keys. A primary key in a dimension table is linked to a foreign key in the fact table. This simple link allows you to combine your rich, descriptive data with your powerful numeric data, unlocking insights you couldn't get from a pile of disconnected spreadsheets.
A final, well-designed data model gives your business a solid foundation for effective decision-making .