


You probably won’t be surprised to read that the data school journey begins not with flashy and technical visualisations but with core concepts.
One of those concepts from Day 2 has been understanding fact and dimension tables and how to use them.
So, what are fact and dimension tables?
A fact table will hold the key records of the data set, whilst the dimension table will hold additional information on the categorical fields in the data set.
A fact table can look something like this:
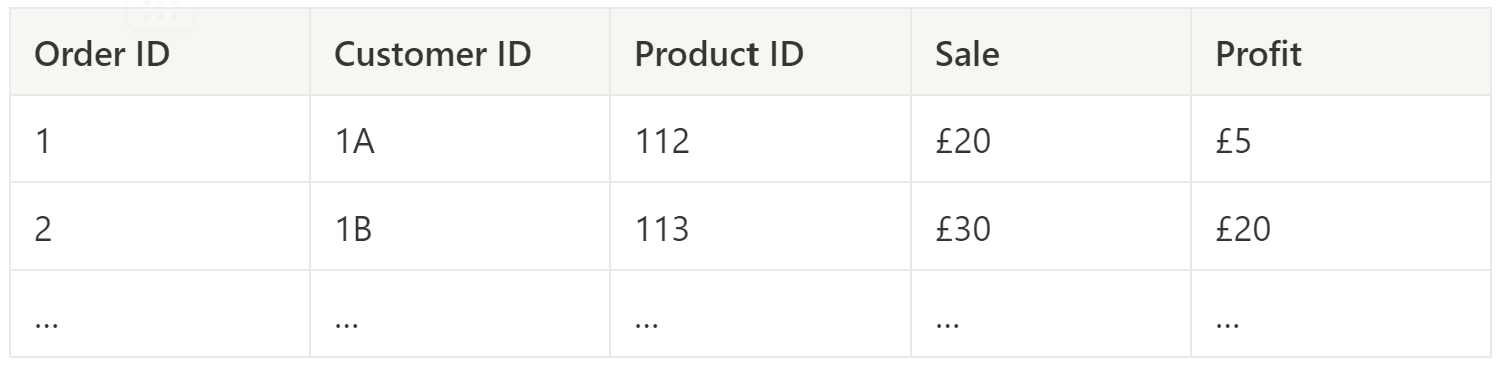
This table provides the key information we need to see if we simply want to examine the number of orders, alongside the sale price and profit.
With dimension tables, we can examine further information regarding both the customer and the product which has been purchased.
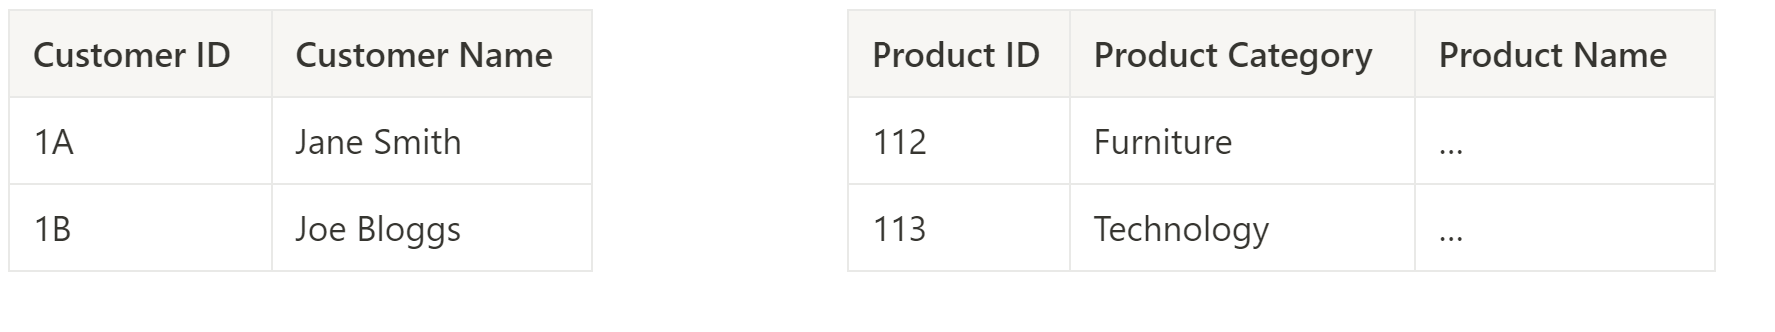
One of the benefits of using fact and dimension tables is that we can reduce the size of the core table without losing information, which can be accessed in the dimension table.