Dynamic zoning parameters allow you to create dynamic, interactive visualizations based on specific zones, giving the user the ability to analyse data in a more targeted way.
So how do we go about making these?
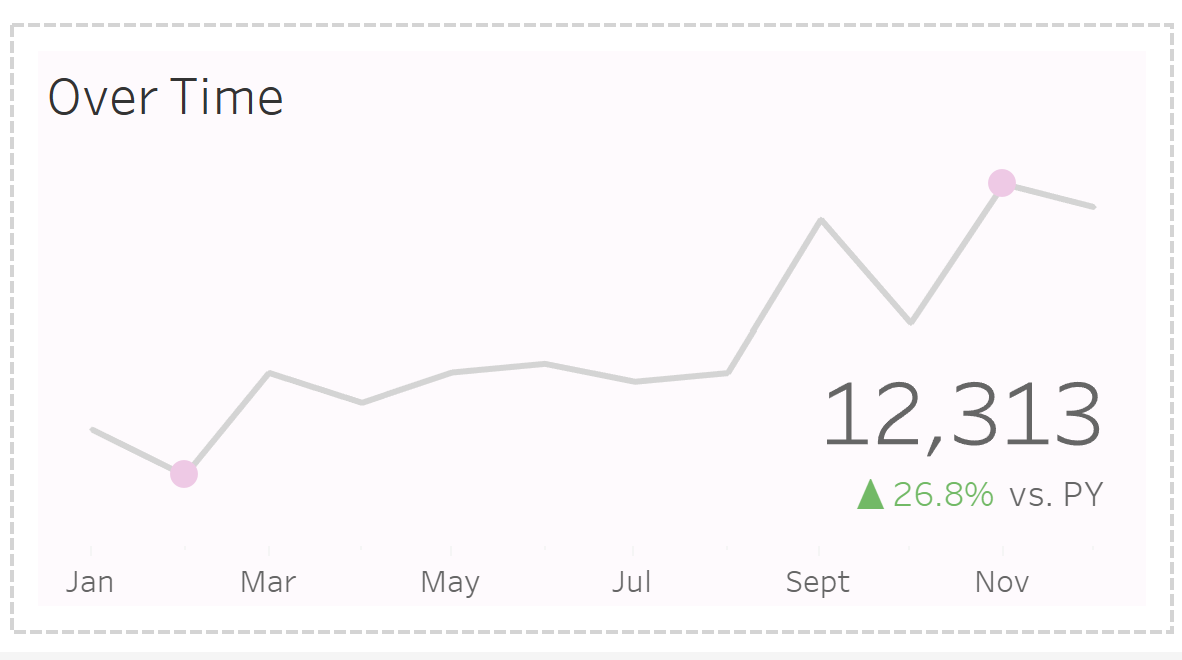
I would suggest you start by creating a section in a dashboard that gives an overview of a topic. That way, the user can choose whether to click zoom in to uncover more about that specific section. Using the Sample - Superstore dataset, this is one I came up with.
Now, we need to create the section the user will see if they select to zoom in. This is where your container game needs to be on point as every item needs to be inside one container. If that's something you're struggling with, I'd suggest trying out Chris Meardon's Layout Helper.
So go ahead and create your zoomed in section - remember everything needs to be inside of one container. Here's what I came up with.
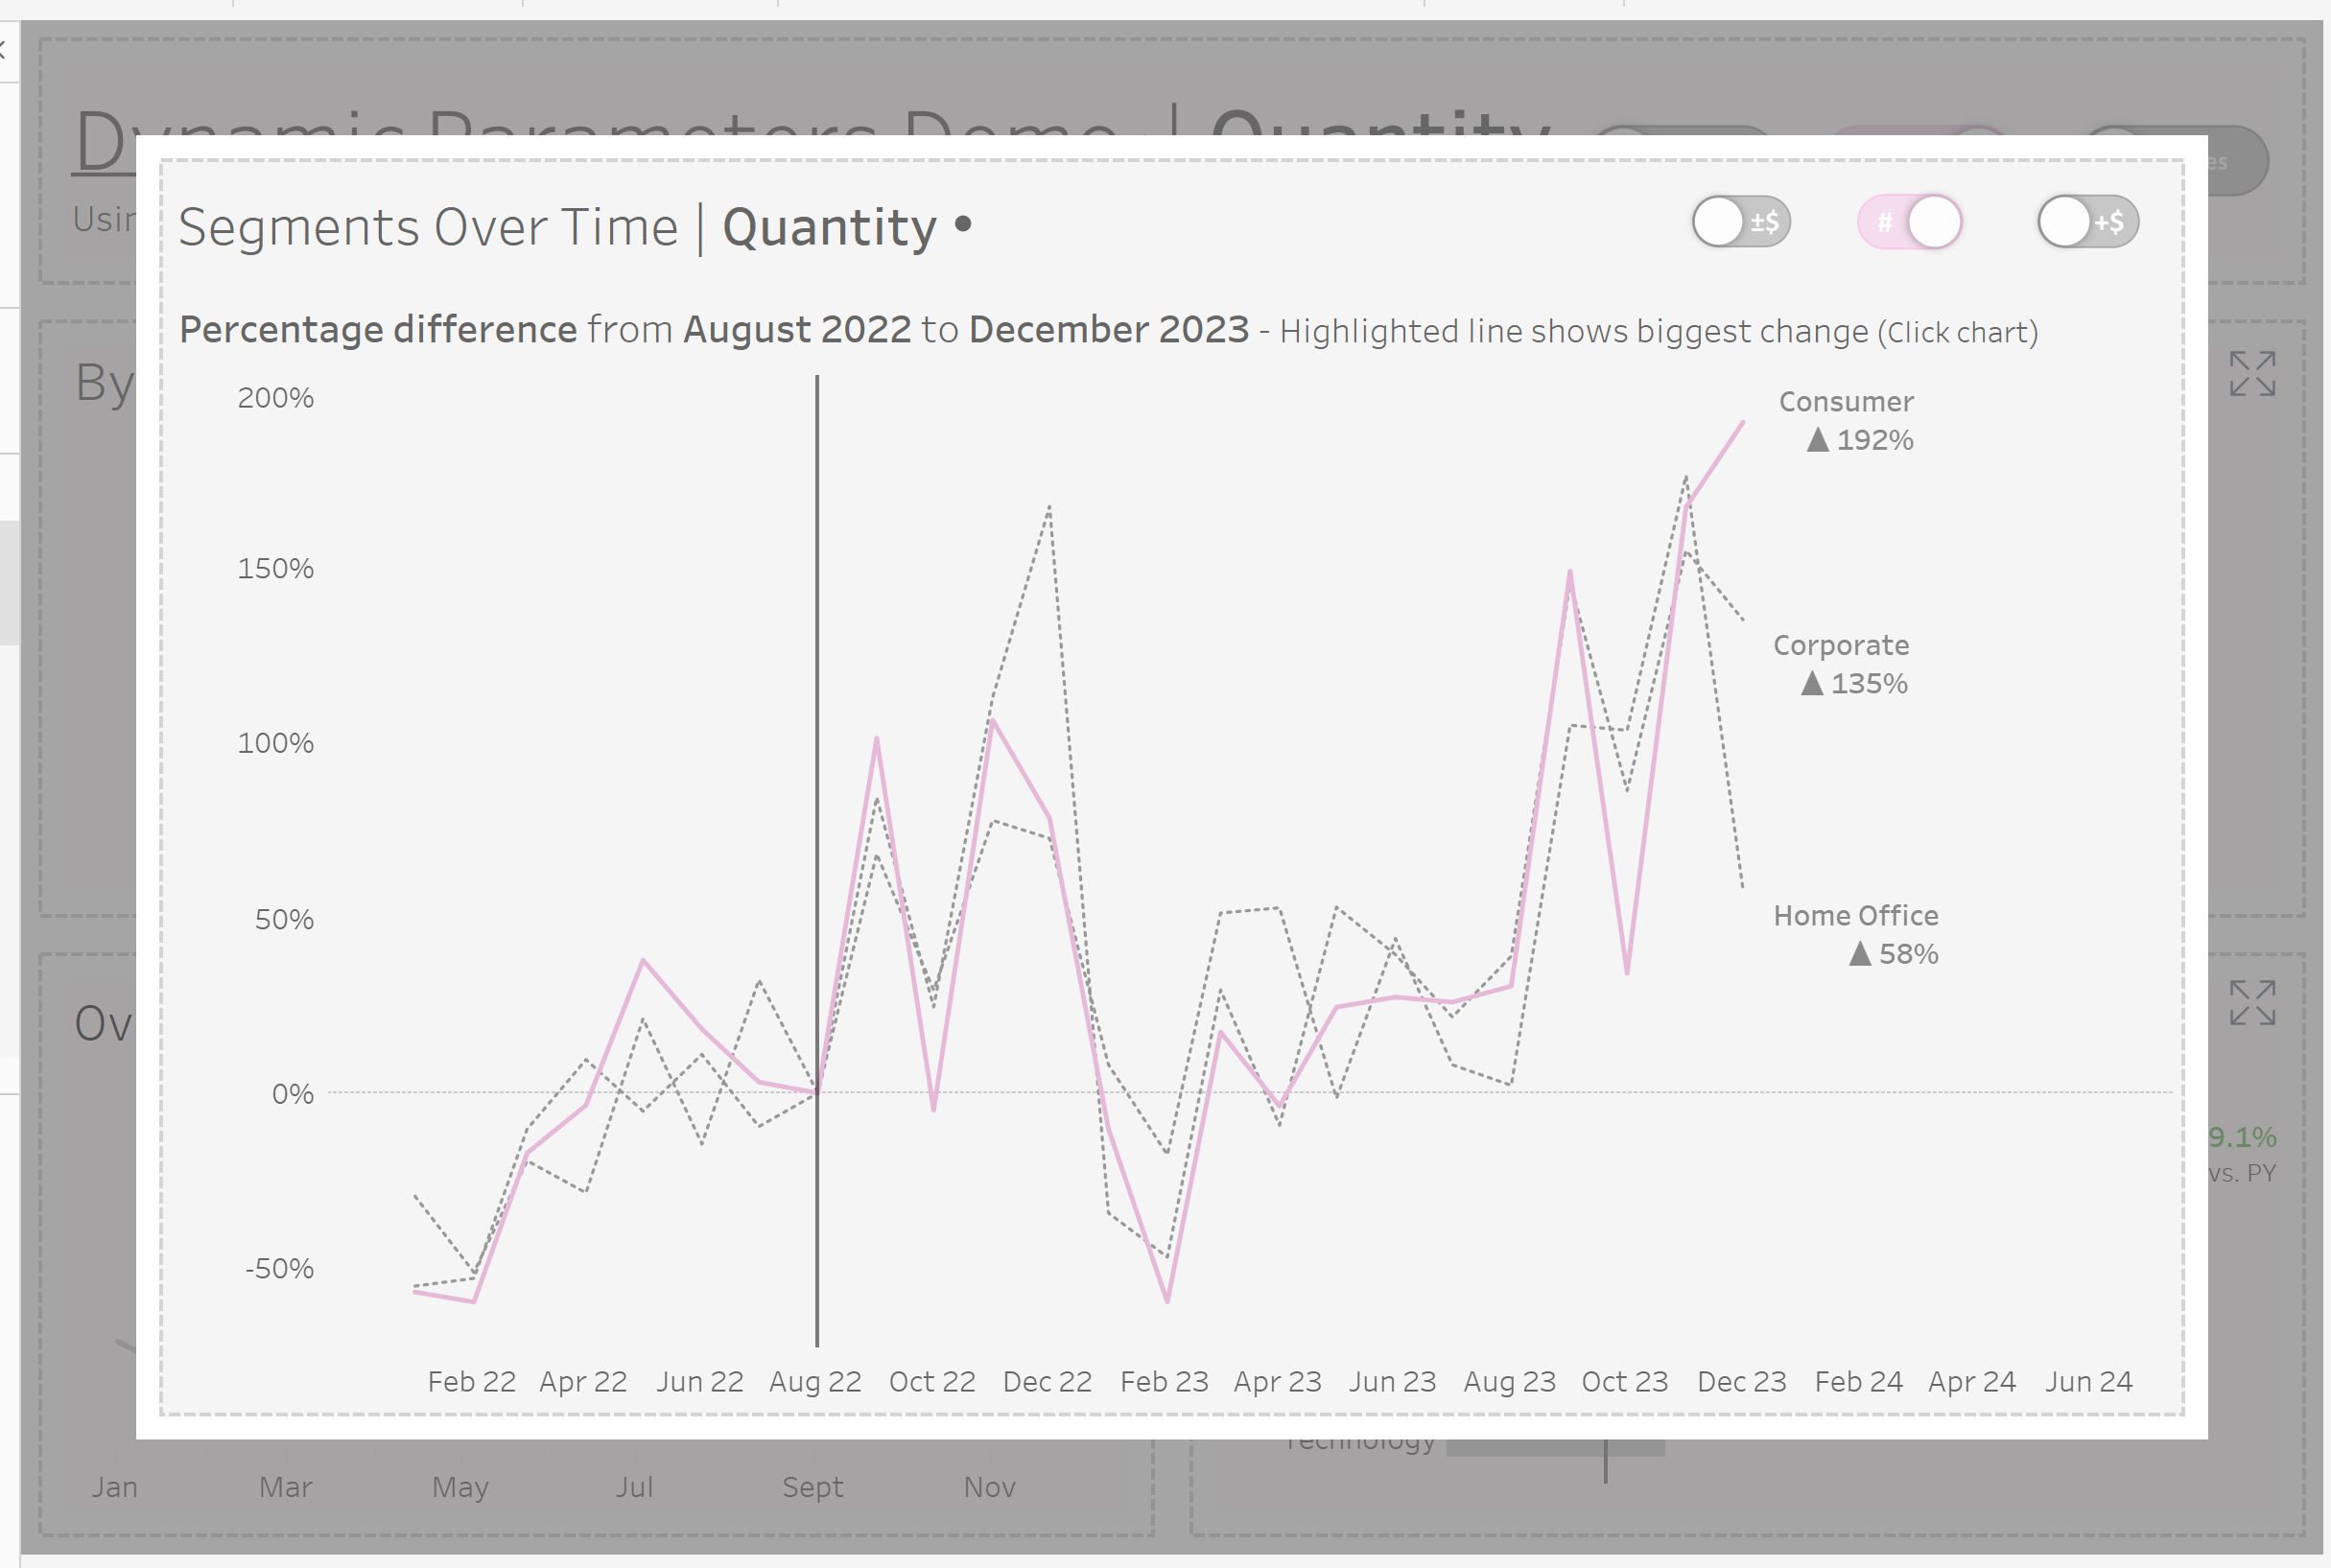
You don't need to have the container be the same size as your dashboard. For my dashboard, I wanted the user to be able to see the greyed out version of the rest of the dashboard, so I created blanks around the main section and reduced the opacity of the background.
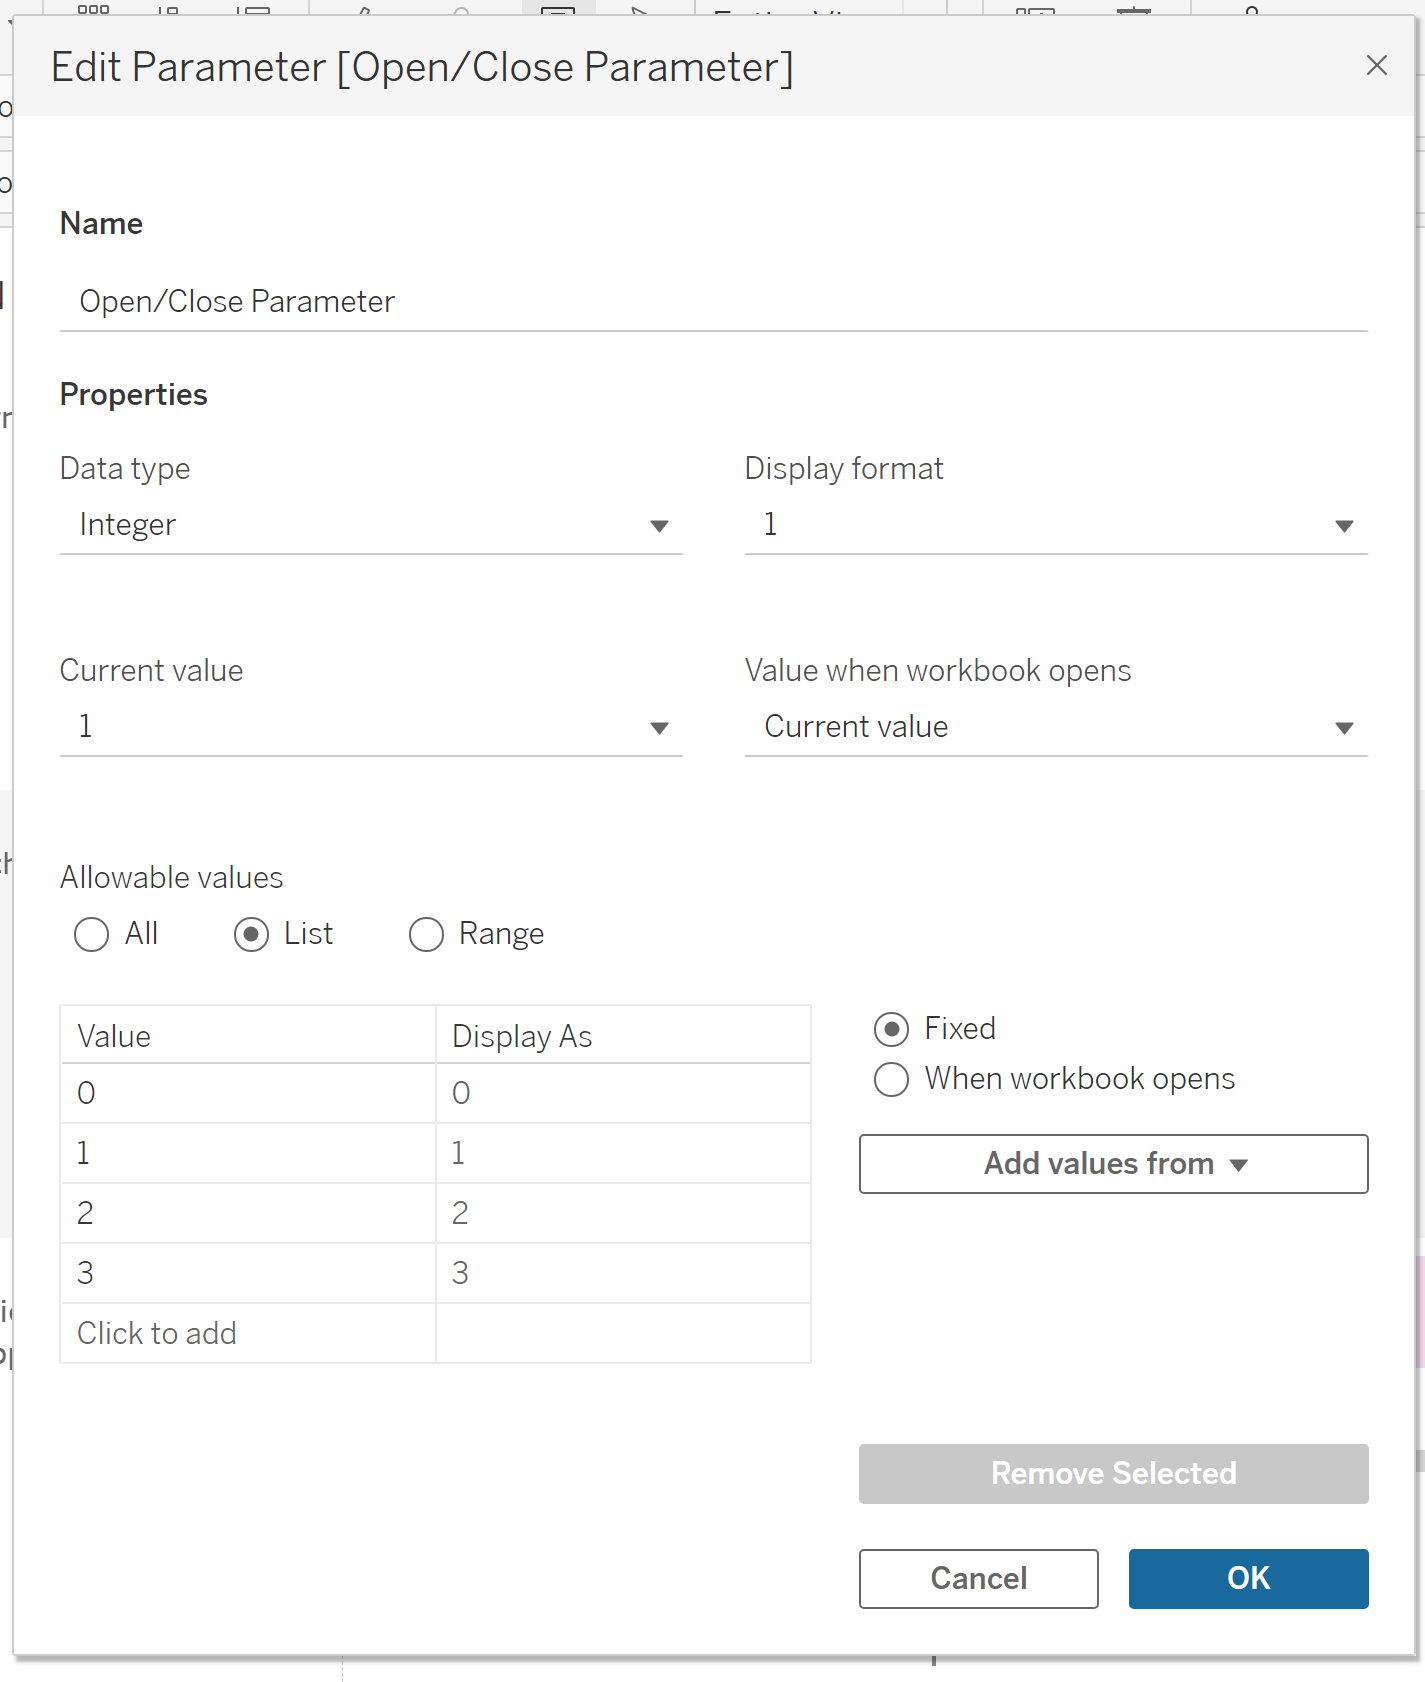
Next lets create a parameter. I'm going to call this Open/Close Parameter, set the data type as an integer and set the allowable values to list. Since I want to have 3 dynamic zones in my dashboard, I'll enter the values 0,1, 2 and 3. 0 will be the value that closes all the zones. If you only want one zone in your dashboard, only enter 0 and 1.
Now we need to create a calculated field which returns a Boolean value (True or False). This will control the visibility of the zone.
T/F 0:
[Open/Close Parameter] = 0
and
T/F 1:
[Open/Close Parameter] = 1
We need to also create some Dummy fields.
Dummy 0:
0
and
Dummy 1:
1
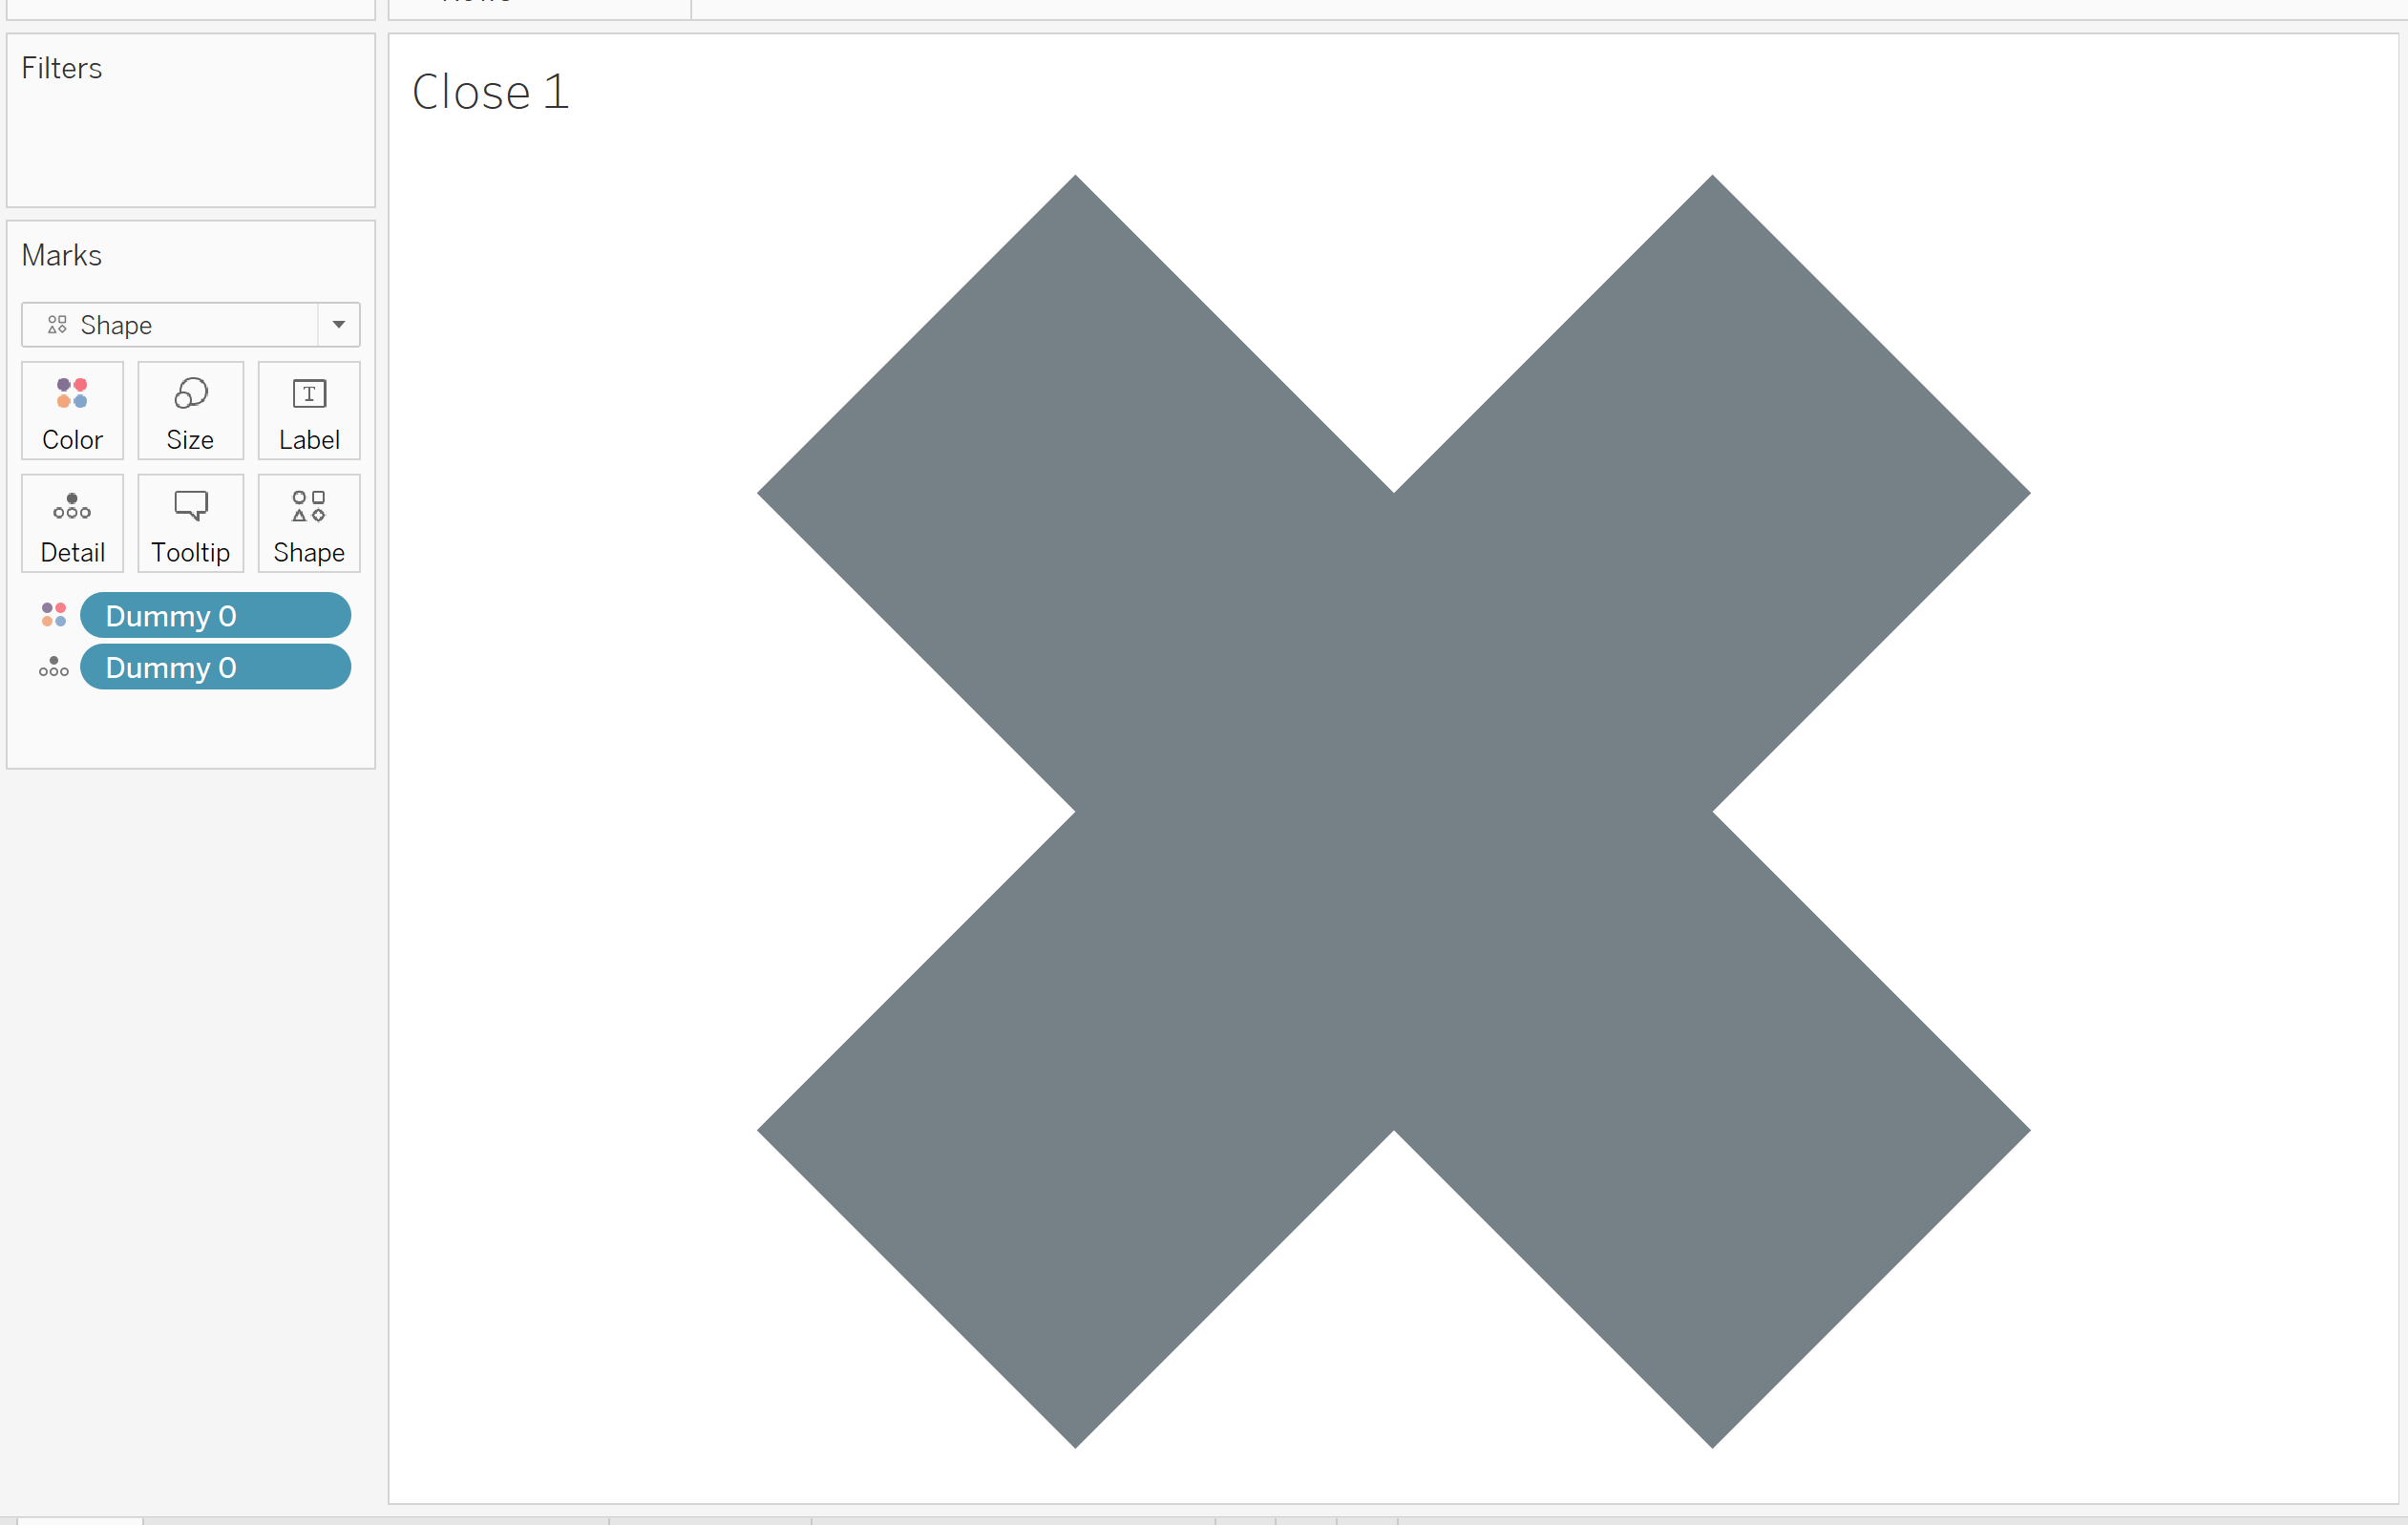
You then want to create a new sheet and give it the title of close 1. Drag dummy 0 into the details mark and change it to a dimension. Click the dropdown and select shape.
If you want to bring in your own shape then find a png image you like online, save it in My Tableau Repository -> Shapes, create a new file and drop it in. When you go back into tableau you can click reload shapes and the new one should appear.
Click on shape and select the one you want to be your opening symbol. If you also want to change the colour of the shape then drag dummy 0 into the colour mark and change it from there. Here's what mine looks like.
Drag this onto your dashboard. Remember, everything needs to be within one container. Select the entire container and in the layout pane, check control visibility using value and in the dropdown click T/F 1.
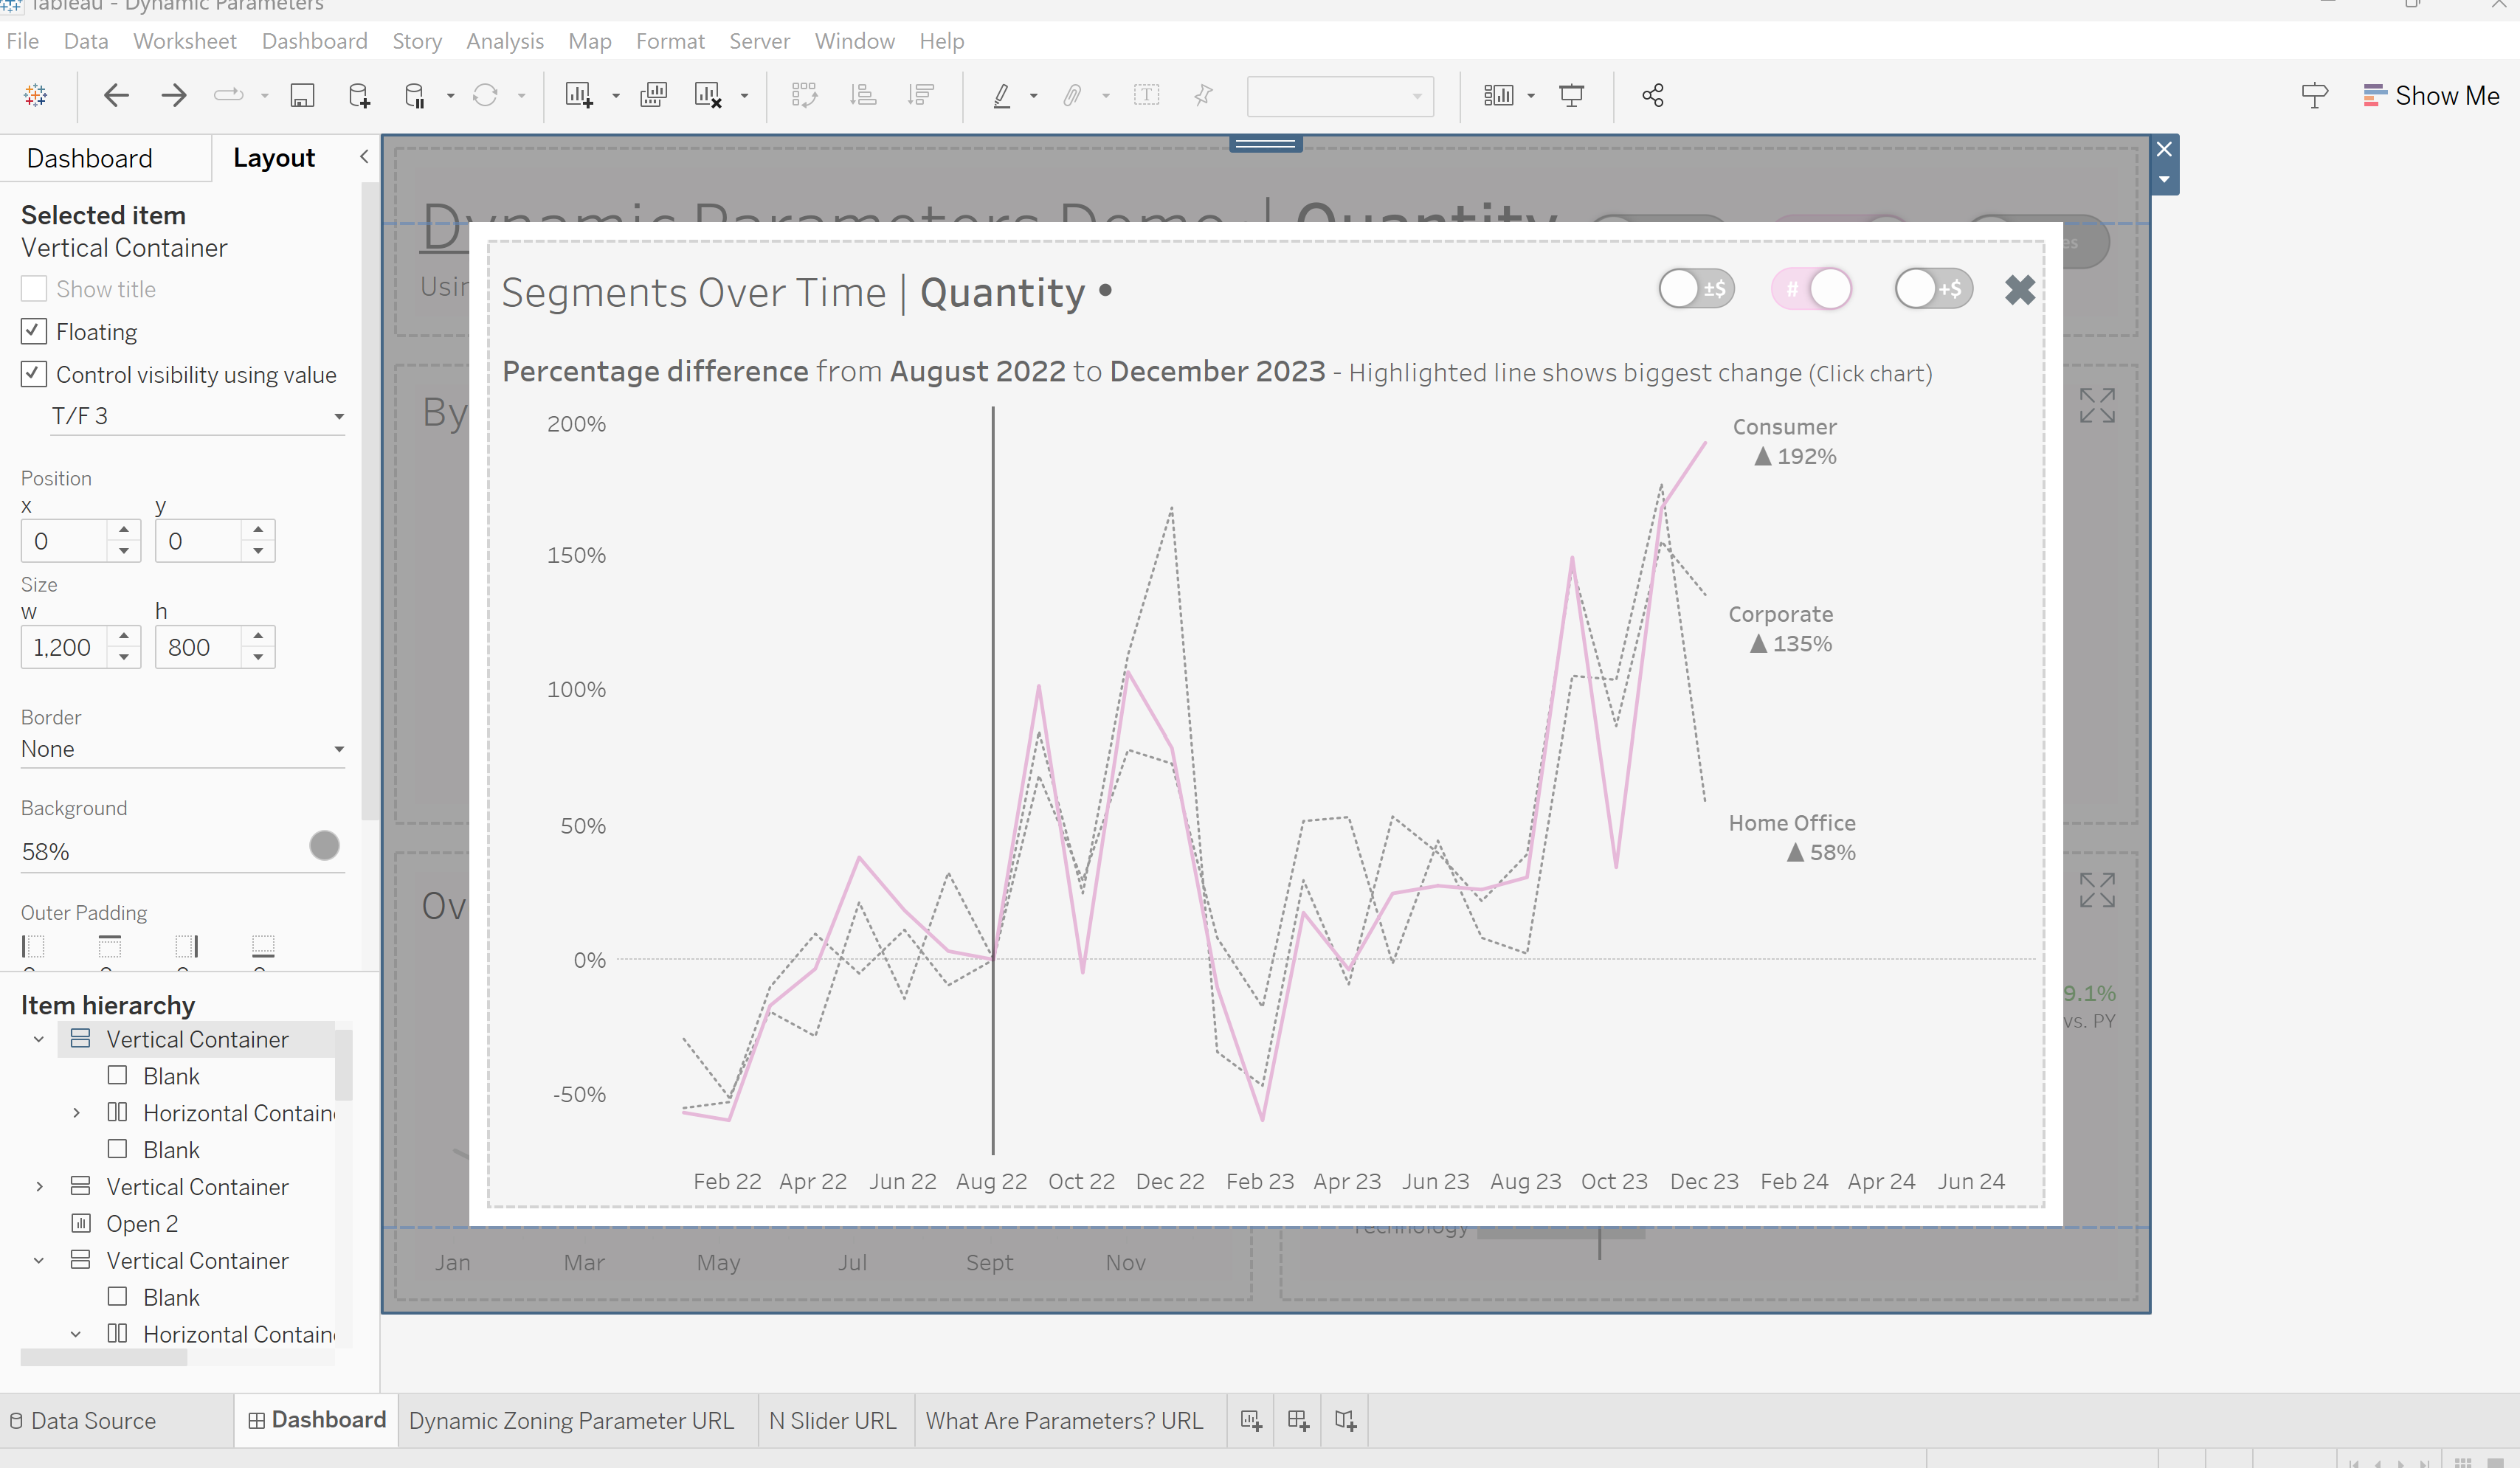
Now your zoned in section should disappear.
Create a new sheet named Open 1 and repeat the steps for creating your close button, this time using dummy 1. Drag this expand button onto the dashboard.
Now click Dashboard -> Actions -> Add Action -> Change Parameter. Change the name to Open 1, select Open 1 as the source sheet, Open/Close Parameter as the target parameter and Dummy 1 on the source field.
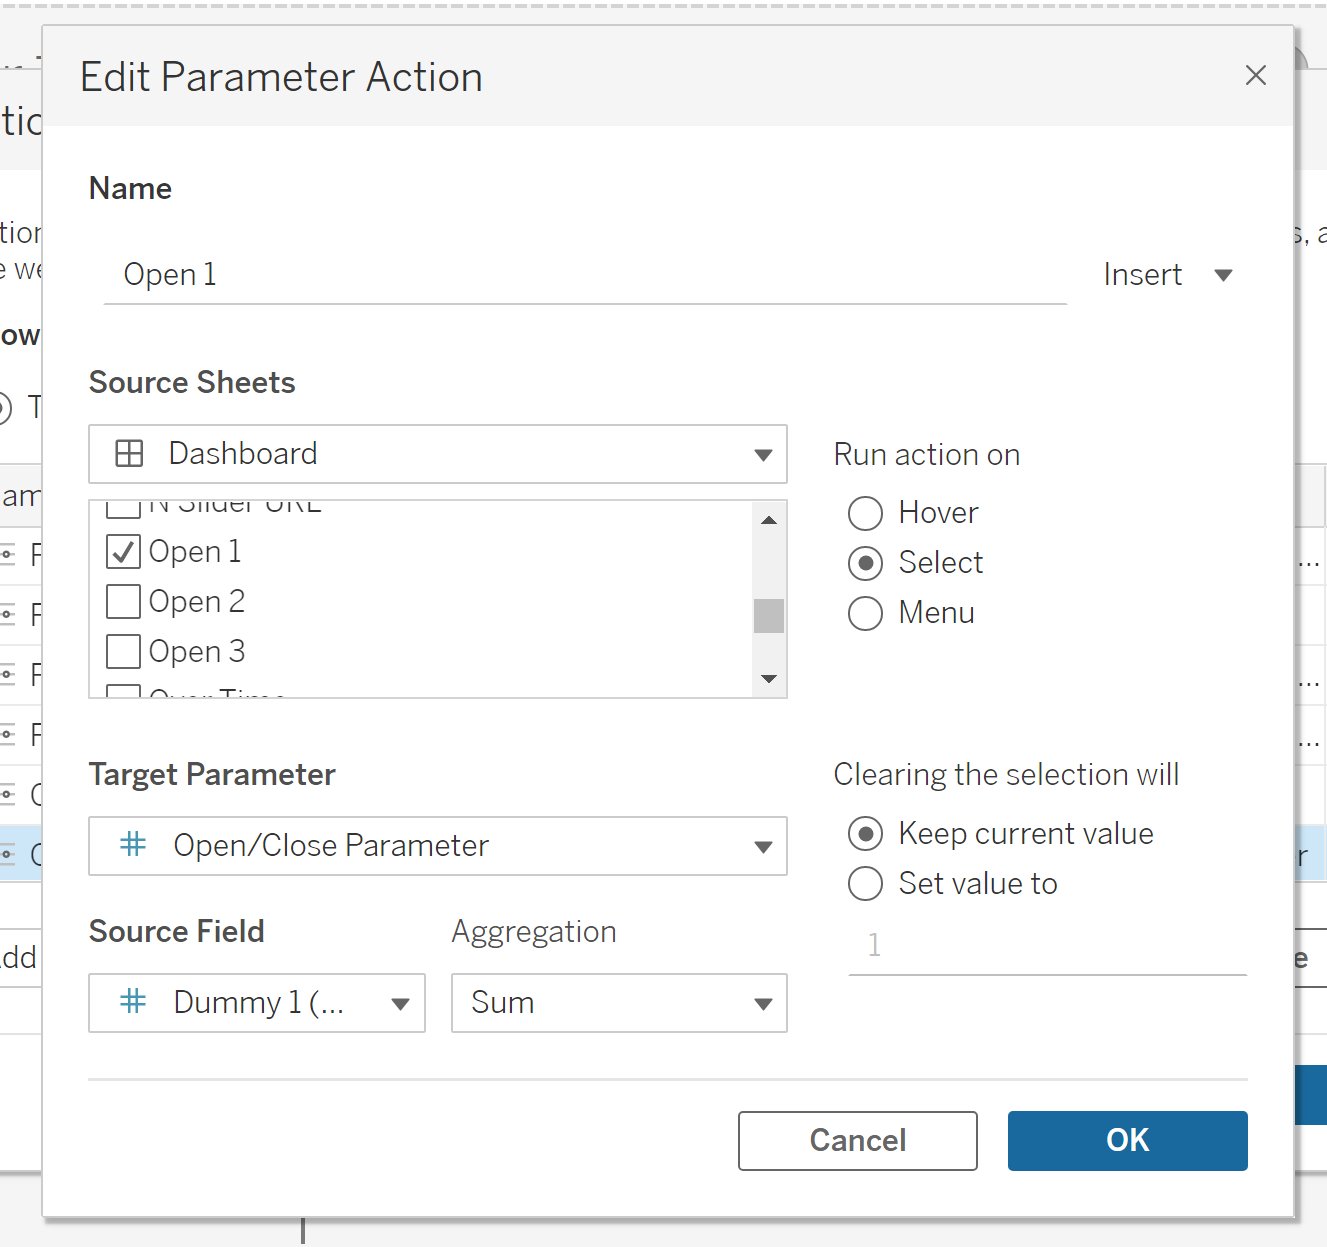
Now, when you click your expand button, you should see the zone.
Repeat this process for the close button using Close 1 and Dummy 0 and you should have a working dynamic zone parameter.
