


Here at the data school, we've spent the past couple of days learning Tableau Prep. Prior to using tableau prep I would spend hours in excel, painstakingly combing through data in order to make it usable. Some of the datasets were huge and required a large number of complicated operations to make it useful, I'd then worry I'd made some small mistake that rendered my entire dataset invalid. Tableau Prep has made this process a whole lot simpler for me. It's mostly set up on a drag, drop basis and what would usually take a while to perform in excel, takes seconds in Prep.
I'm going to focus on the aggregation feature of Tableau Prep in this blog. Put simply, aggregations allow you to perform calculations on a field. All you need to do is selected your grouped fields and aggregated fields and you're done.
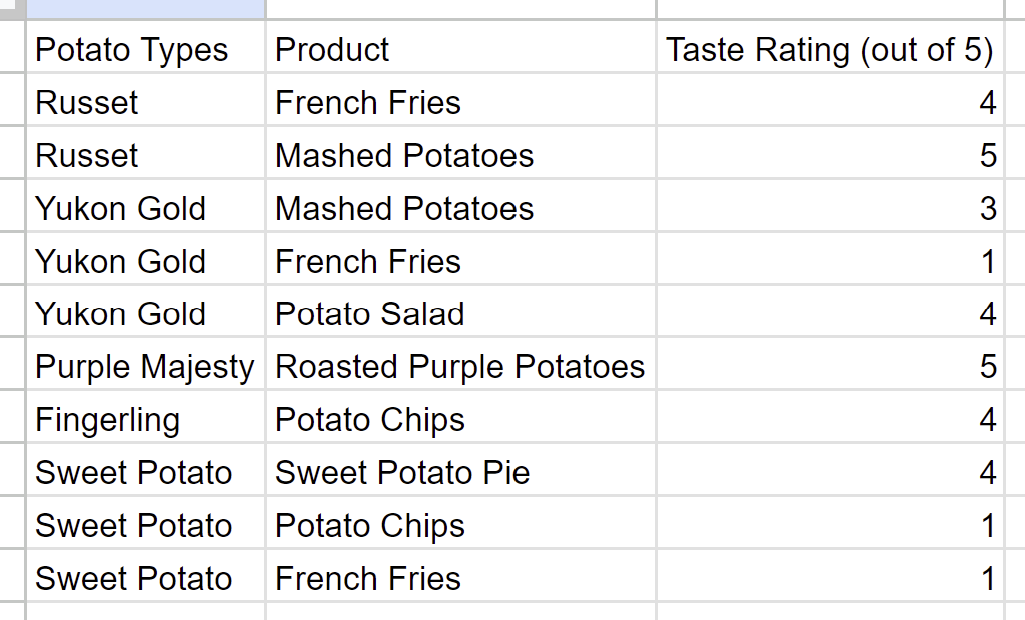
Looking at the taste ratings of potato products sold at a store in the below table for example.
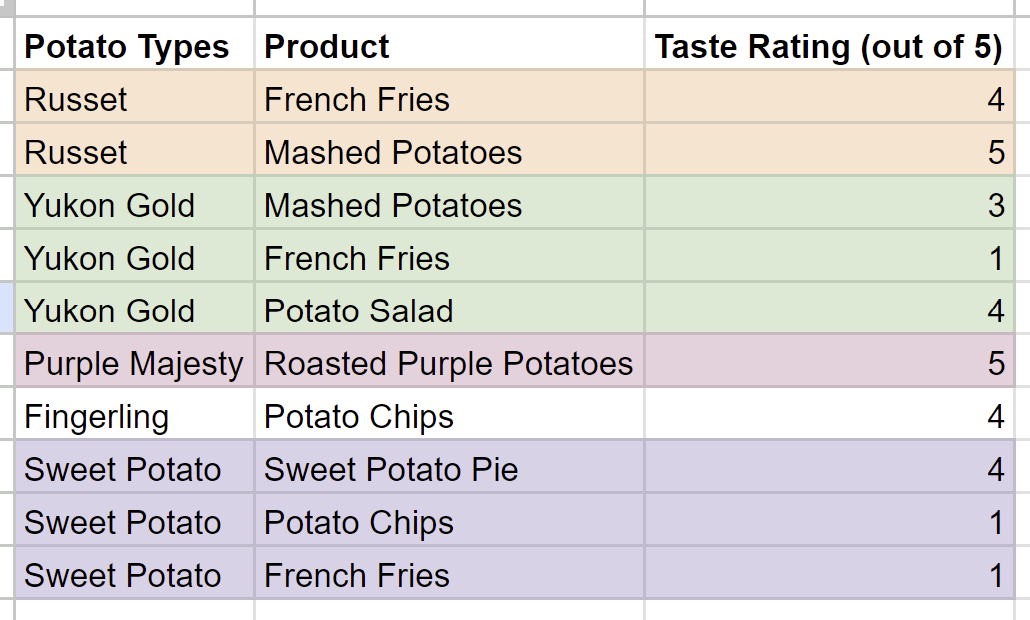
Rather than having each potato type and product in the dataset, it might be more useful to see average taste ratings based on the potato types. This would be grouped as shown below.
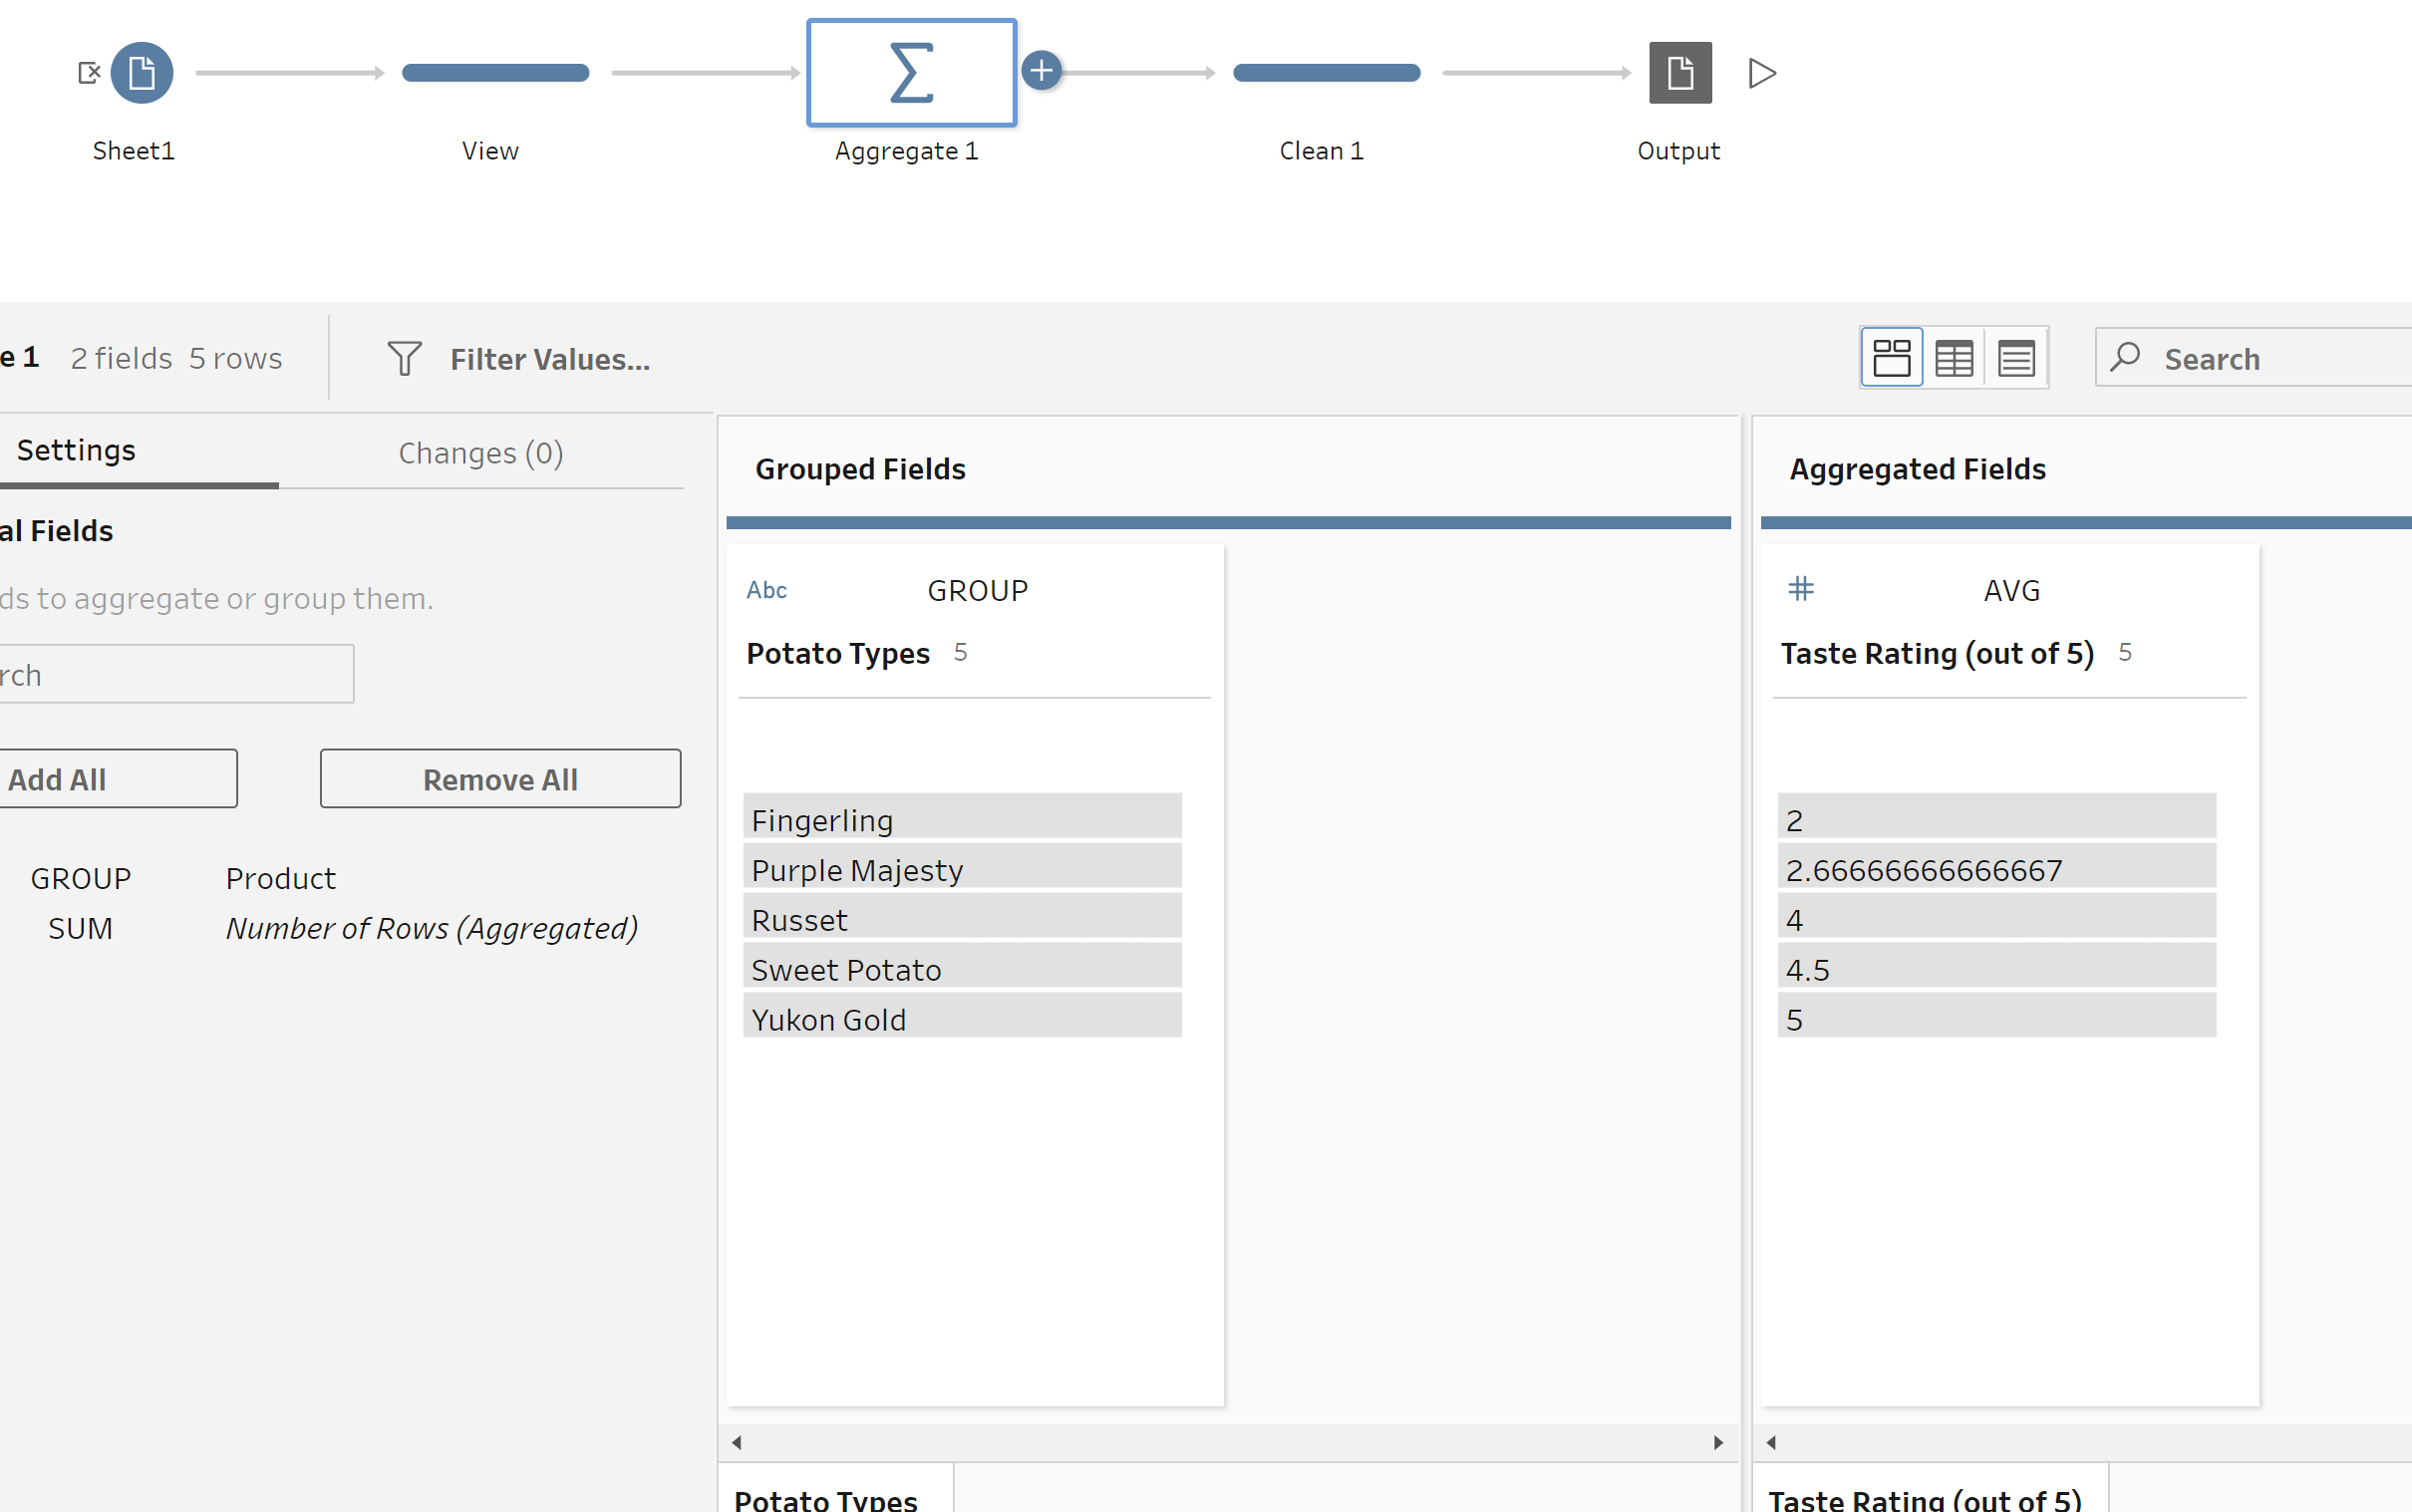
In order to do this we need to go into tableau prep, open the document and create an aggregation step. We then drag potato types into the grouped field and taste rating into aggregated. The default in Tableau Prep is to set this calculation to SUM, if you click the dropdown though there are plenty of other calculations to choose from. Here we'll go for average.
Then is just to add an output step, run, and save the output and workflow. Then we're done!

Here is our output. We can see Purple Majesty potatoes are the highest scoring and sweet potatoes are the lowest. I should probably add here that the taste scores were for demonstration purposes only and don't represent my actual views.
If there are more fields you want to group and aggregate, Tableau Prep allows you to do it in the same step. Just drag your fields over to the correct column and you're done.