


So here we are, bump charts. Informative, interactive and most of all, really flipping cool. Bump charts are used to show the changes in rank, making it easy to compare the performance of different categories over time.
At first glance bump charts may look rather complicated or difficult to make, however you're in luck; this blog will give you a step-by-step guide of how to build them in Tableau.
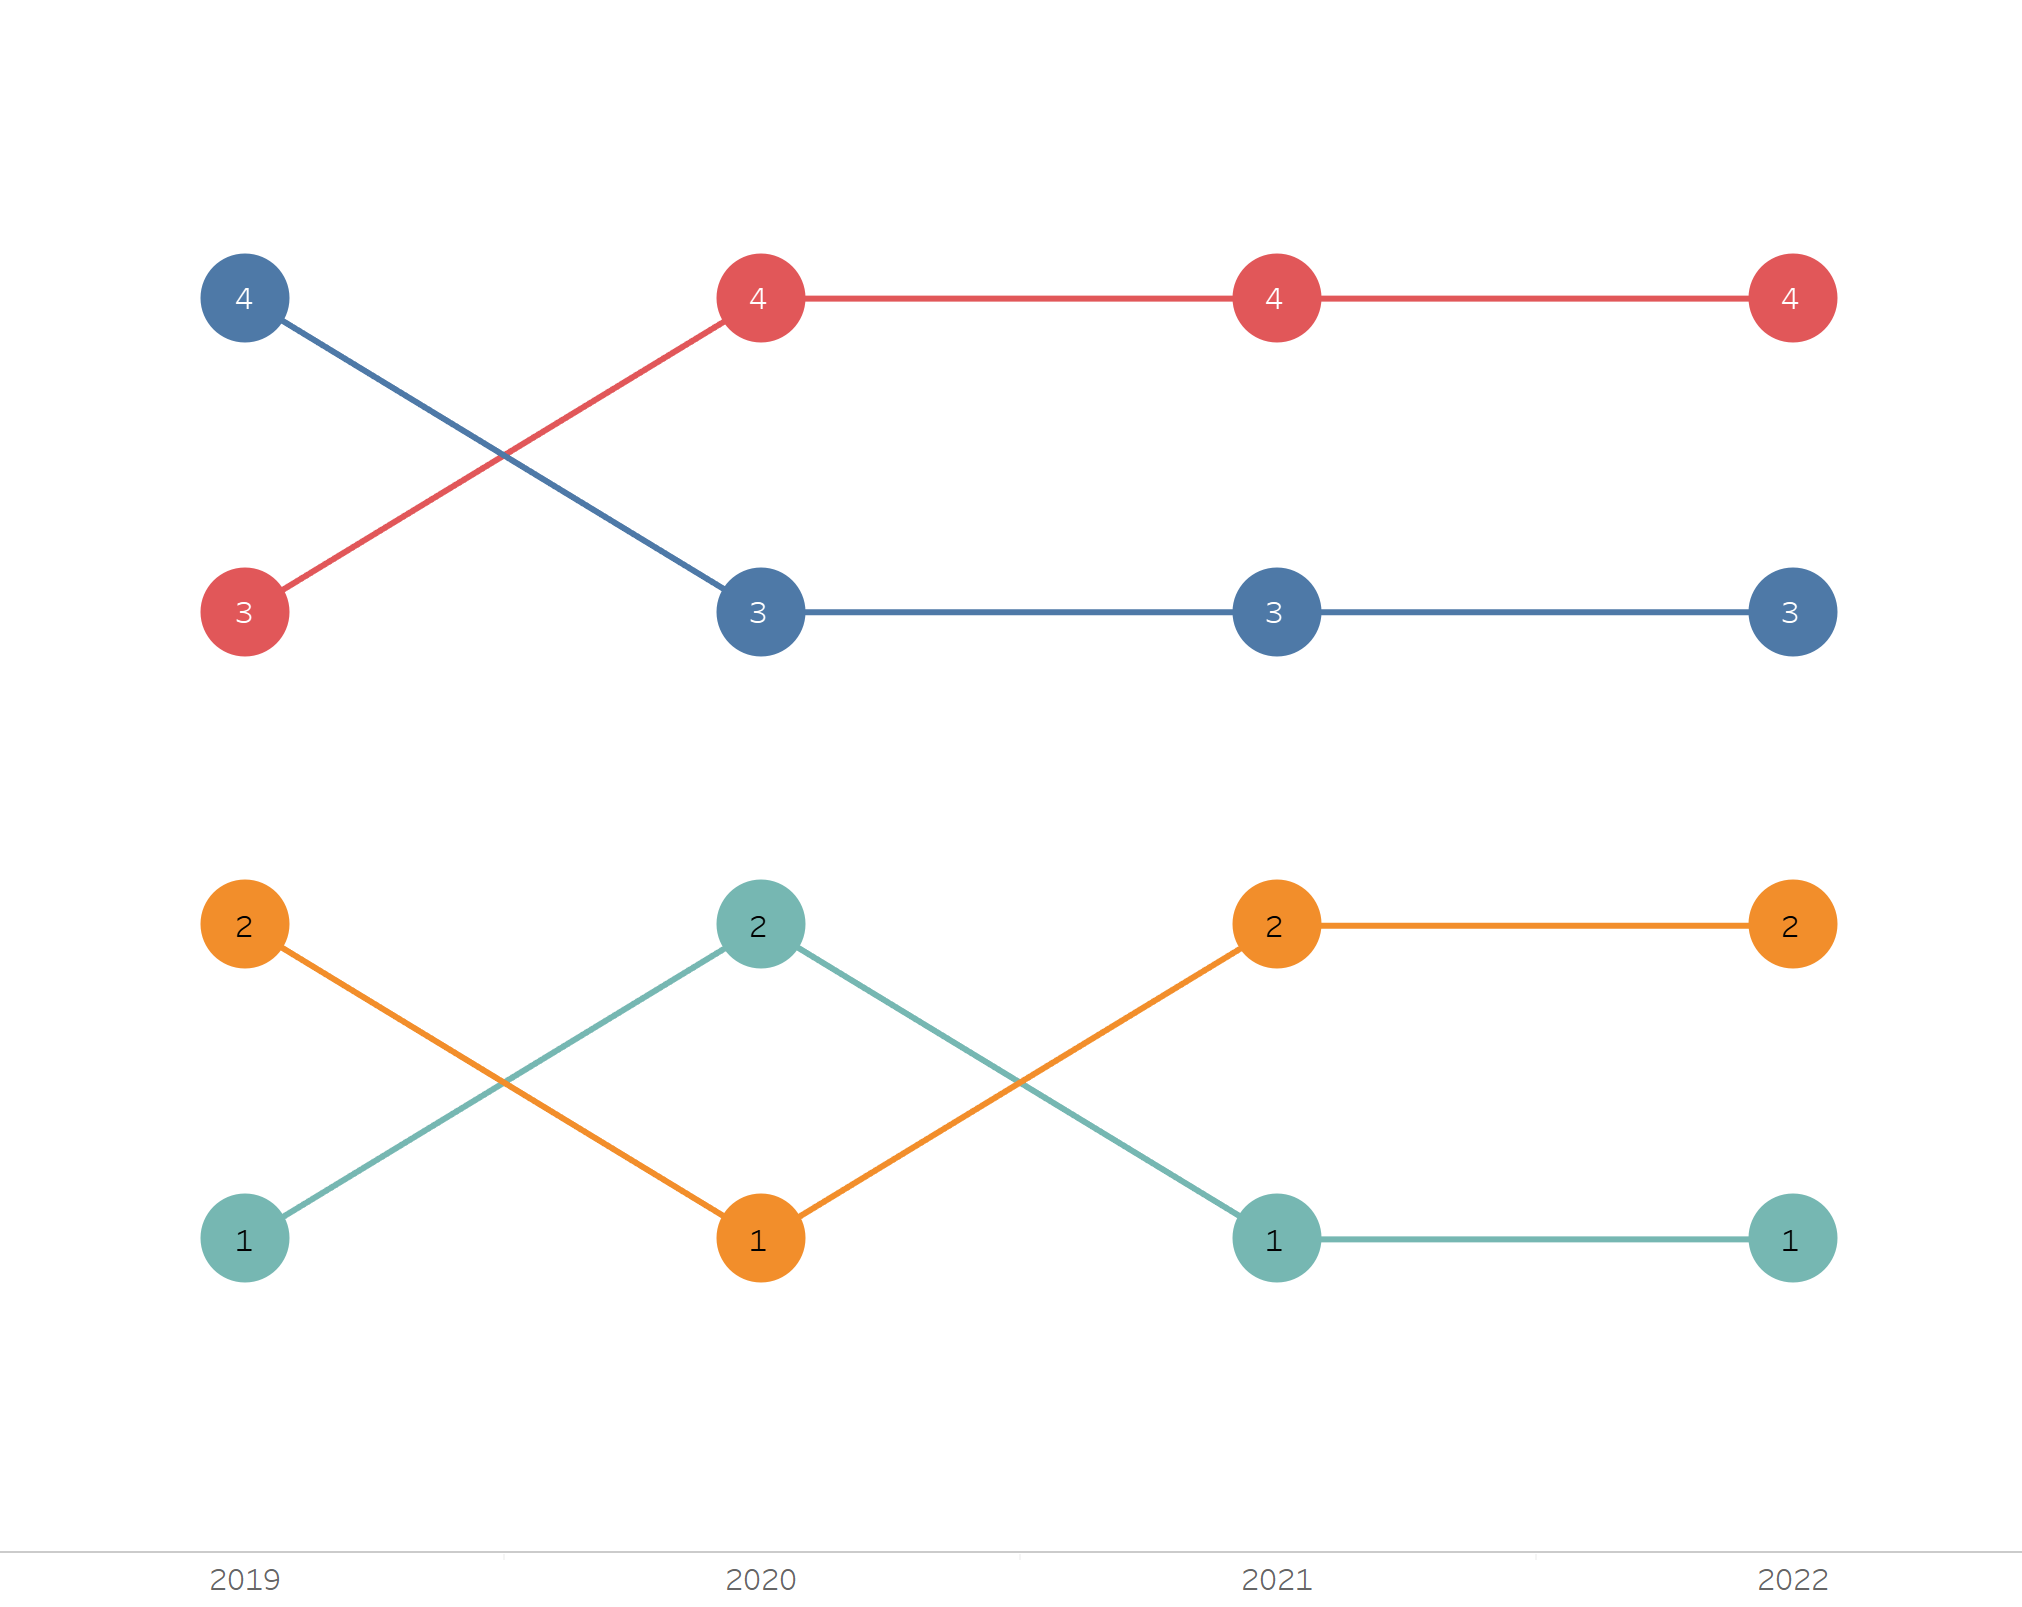
In this example, we want to compare how the sum of sales change over the years for different regions.
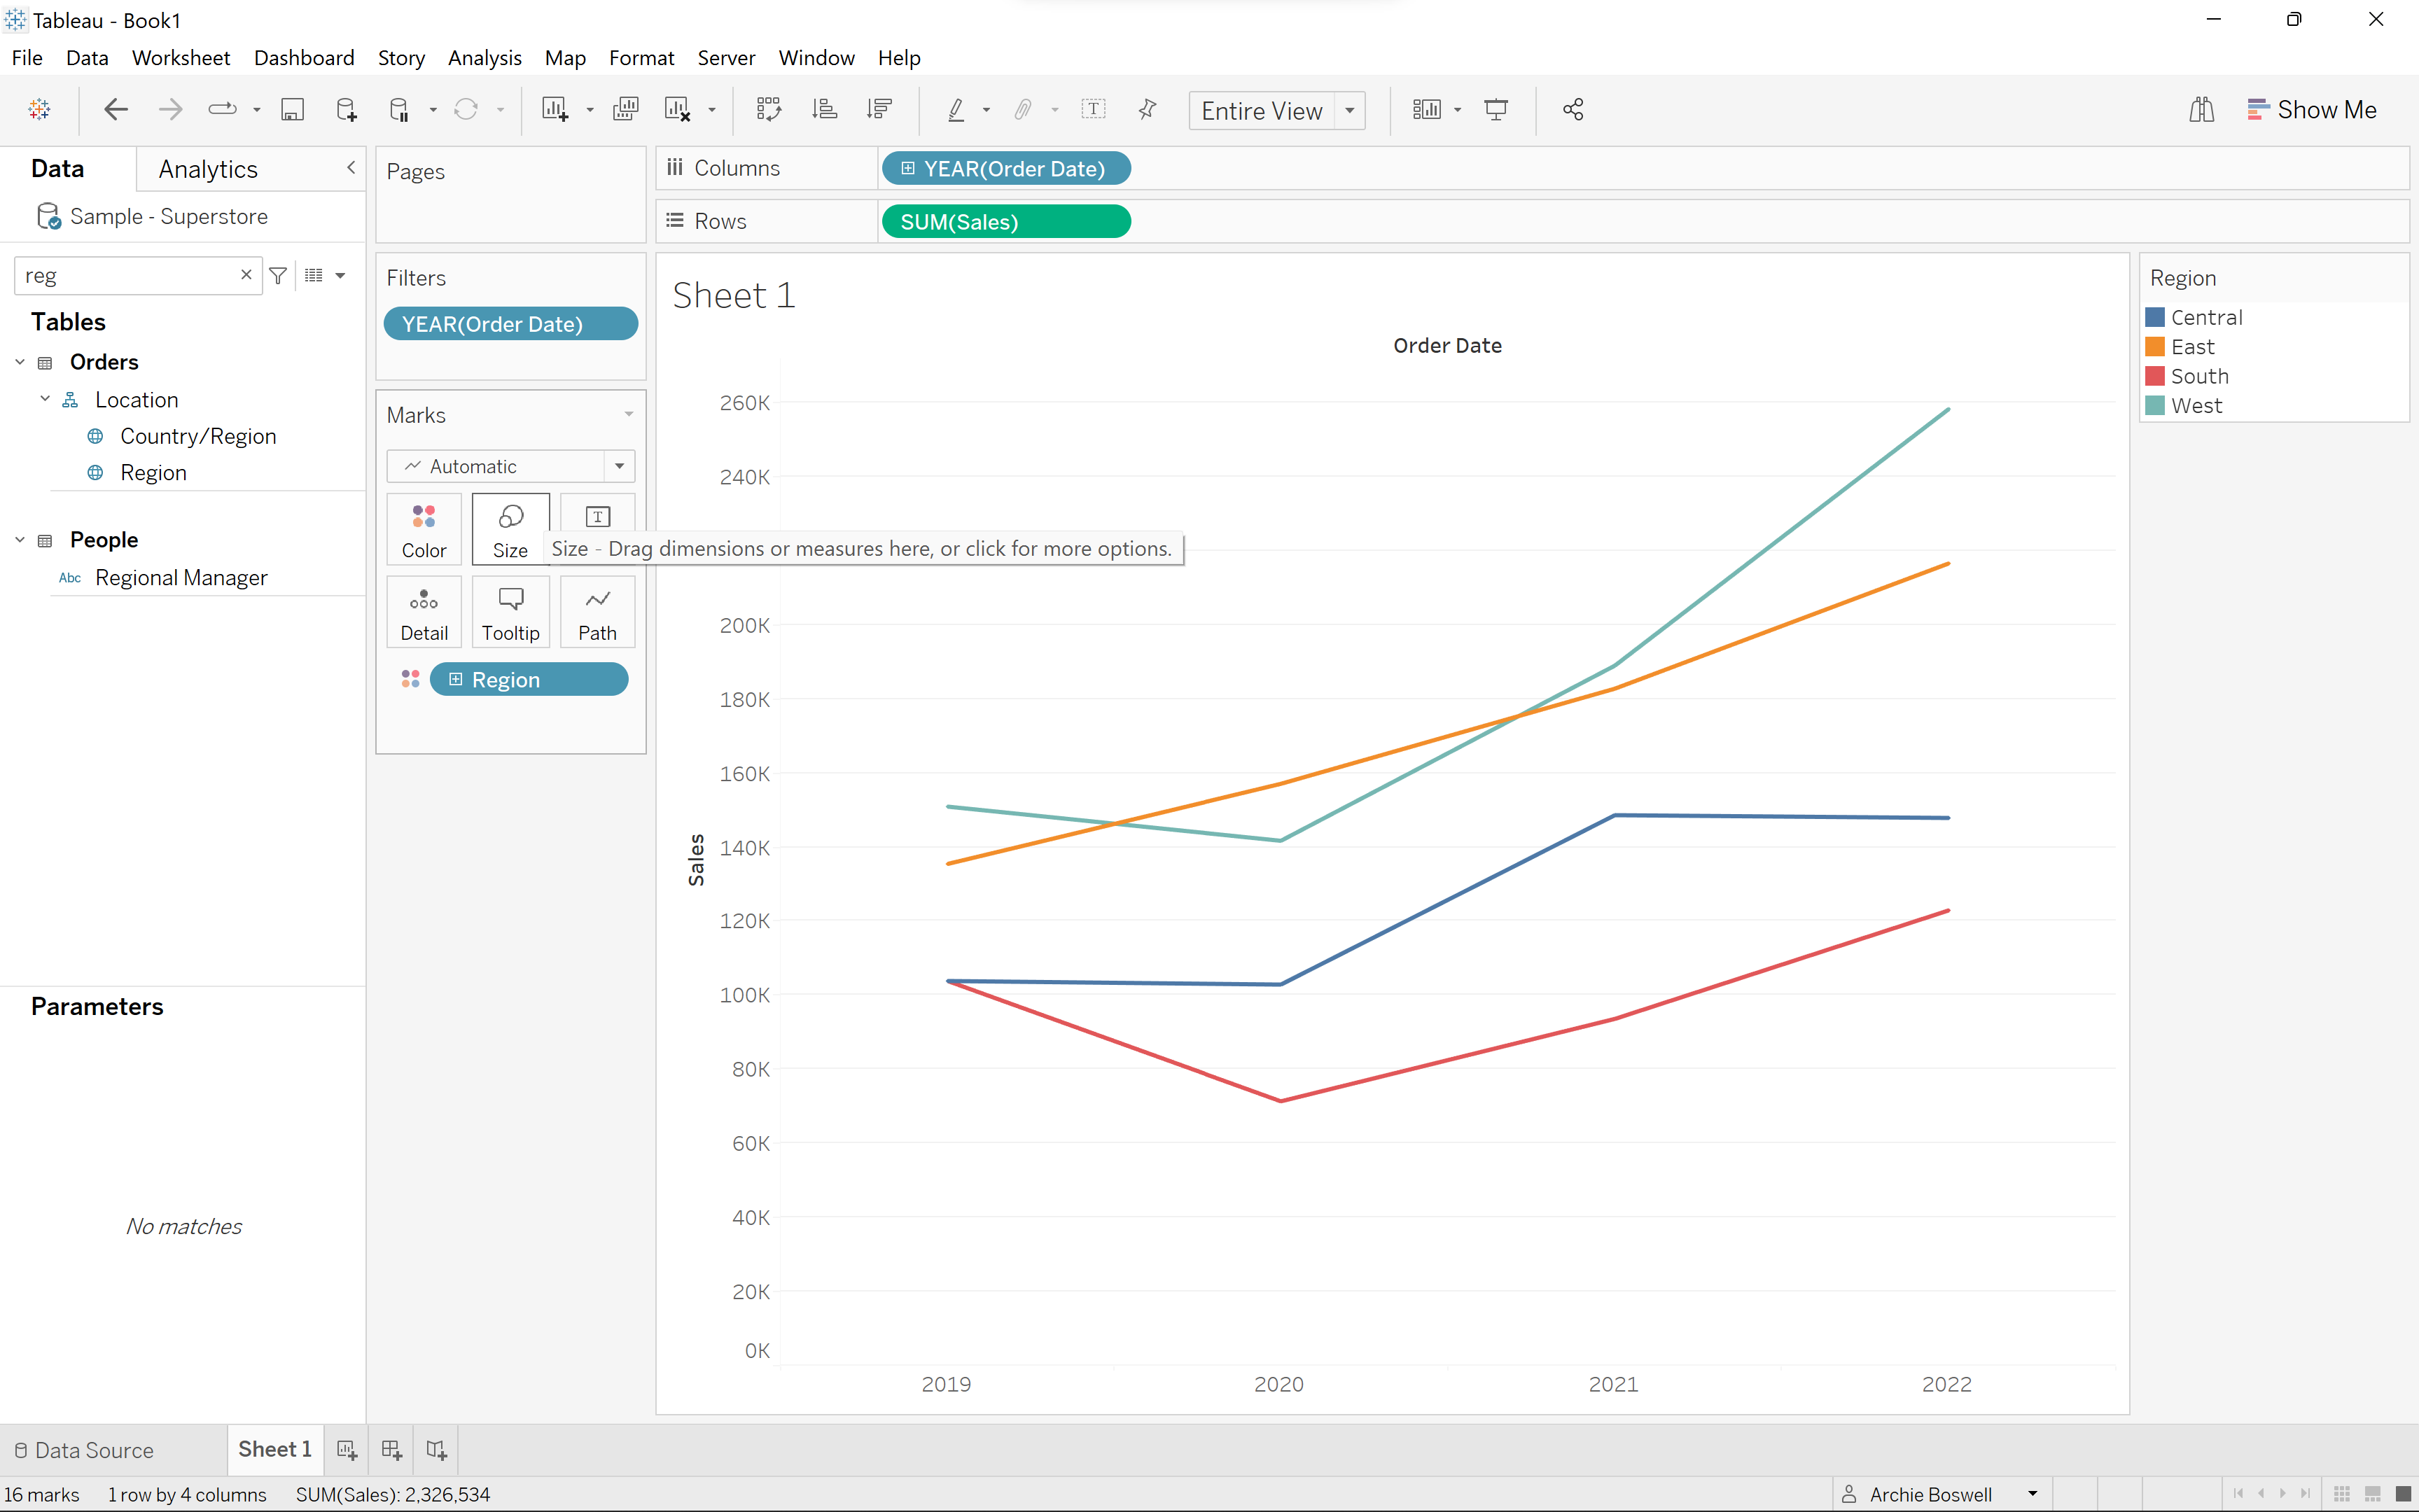
Start by dragging the the year to the columns (filtering if necessary), the sum of sales to the rows and what you are comparing to the colour section in the marks card-
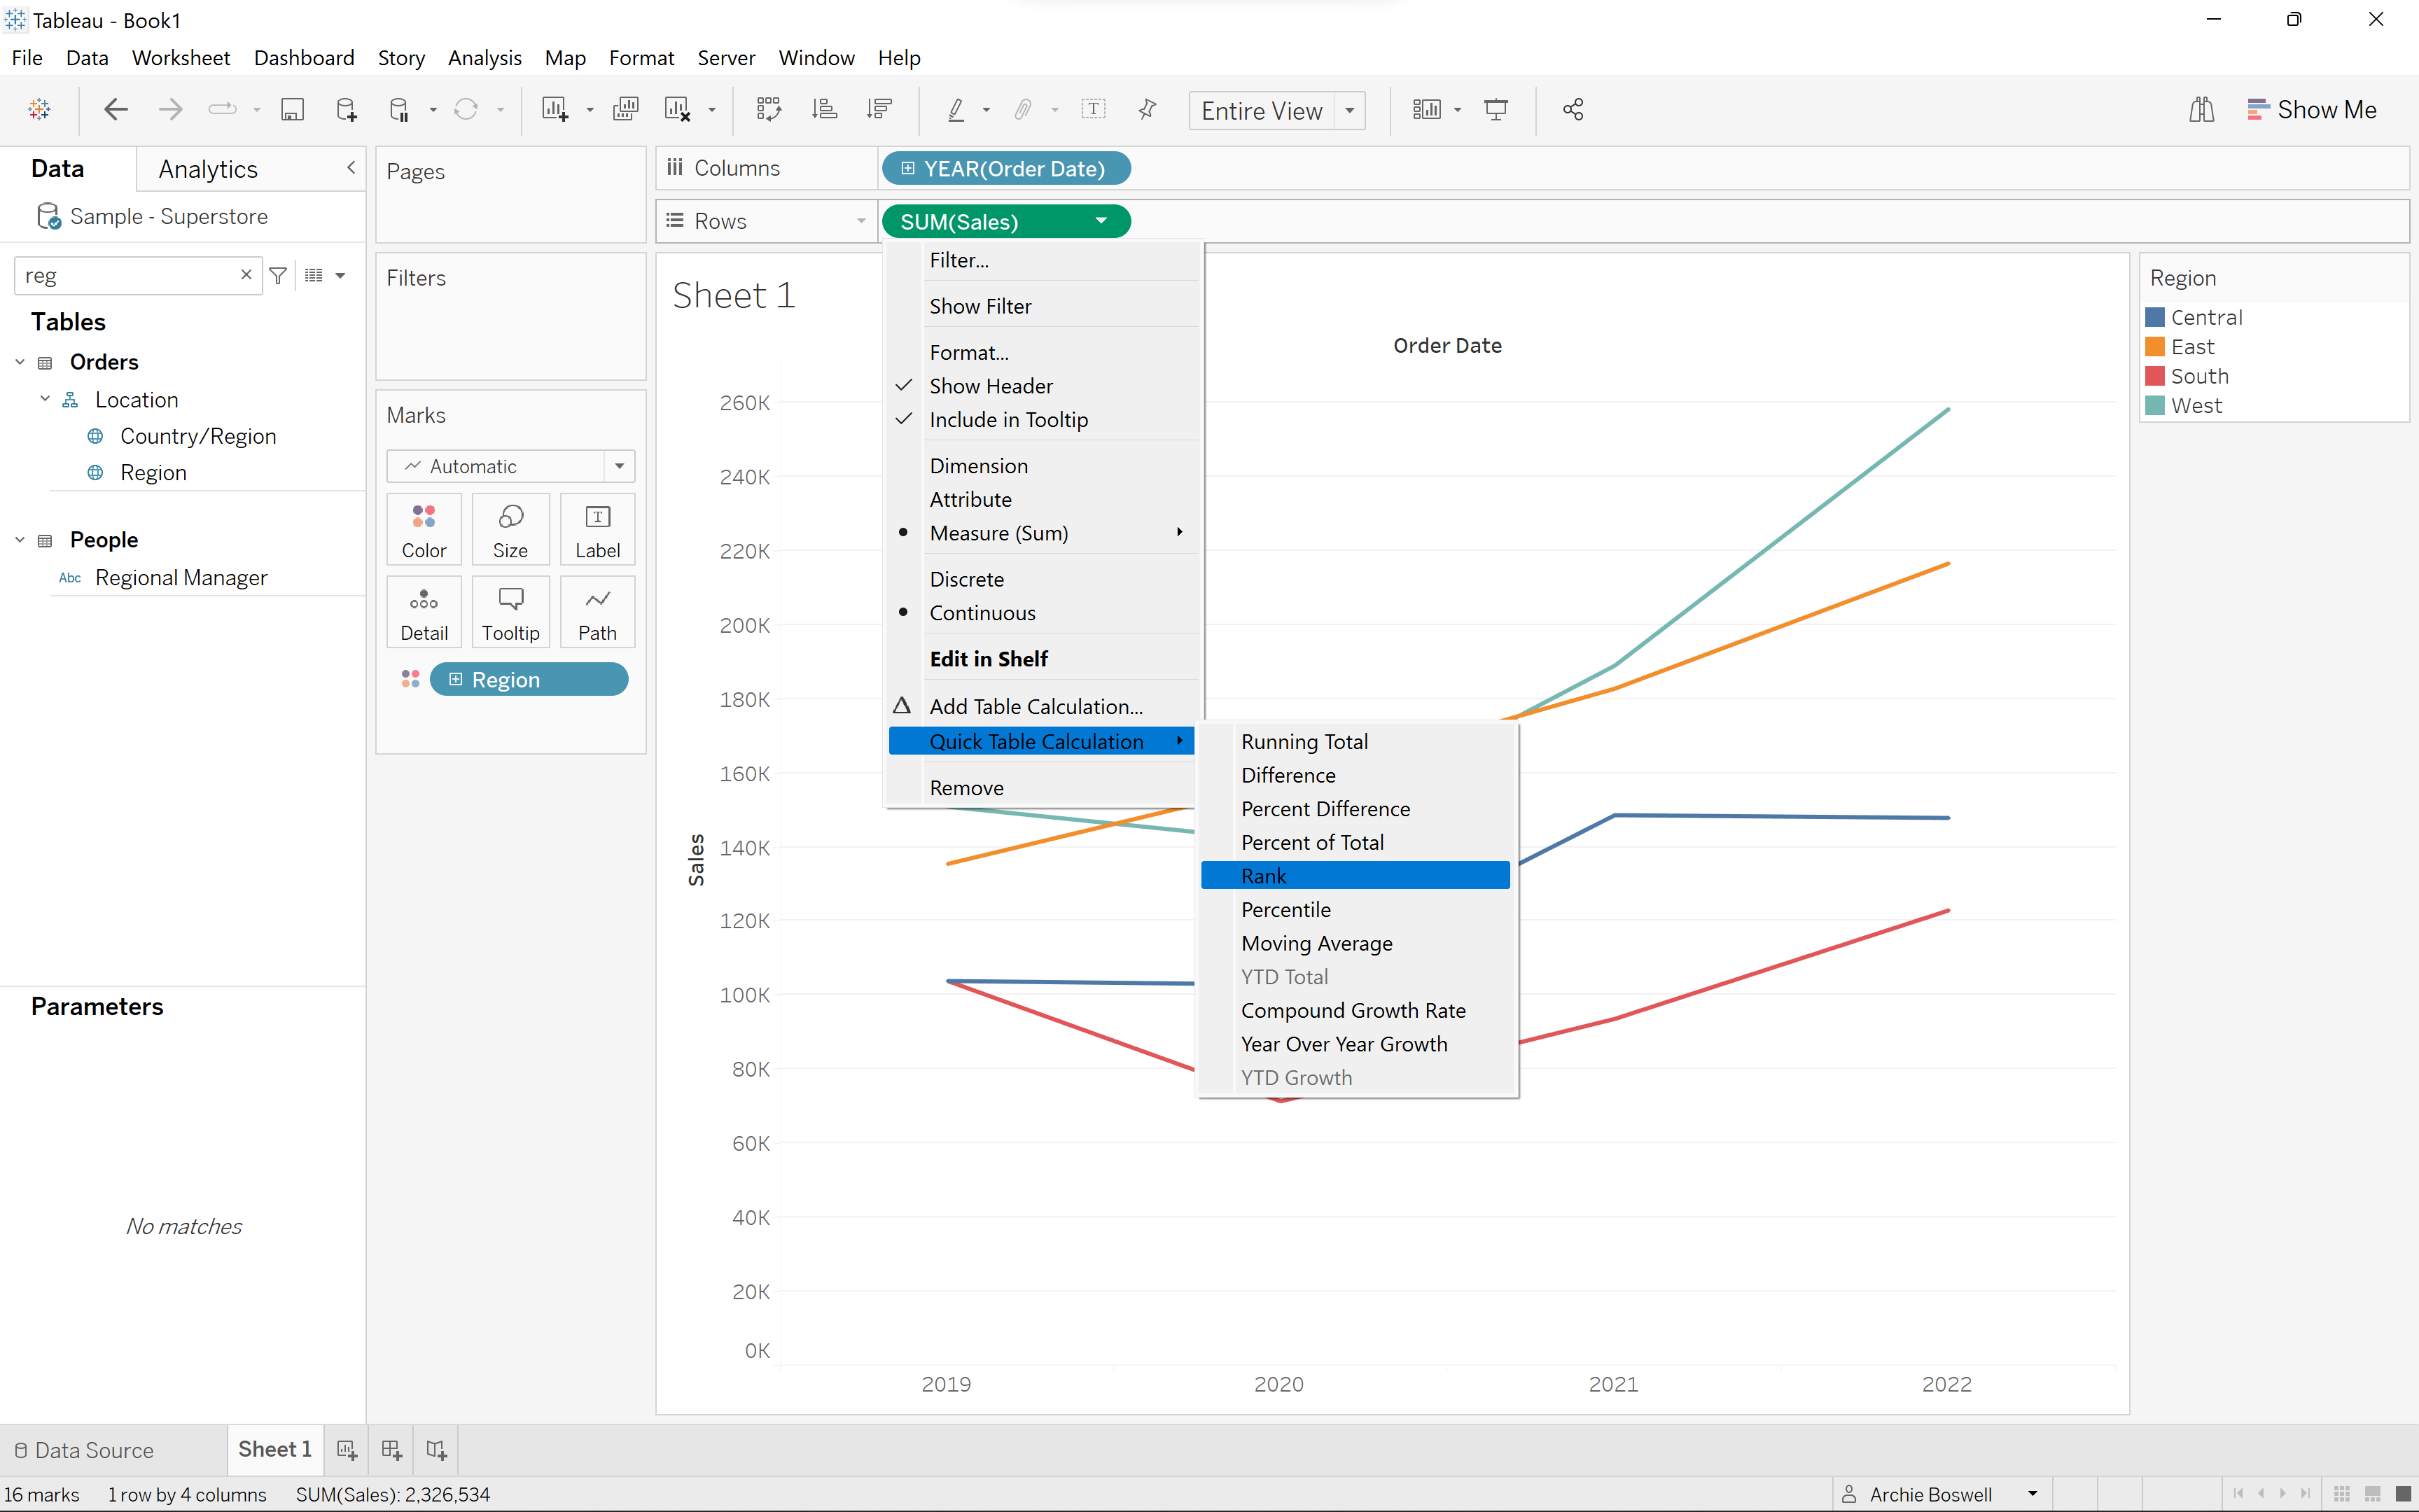
We now want to rank the sum of sales by clicking the drop down menu and choosing the necessary table calculation.
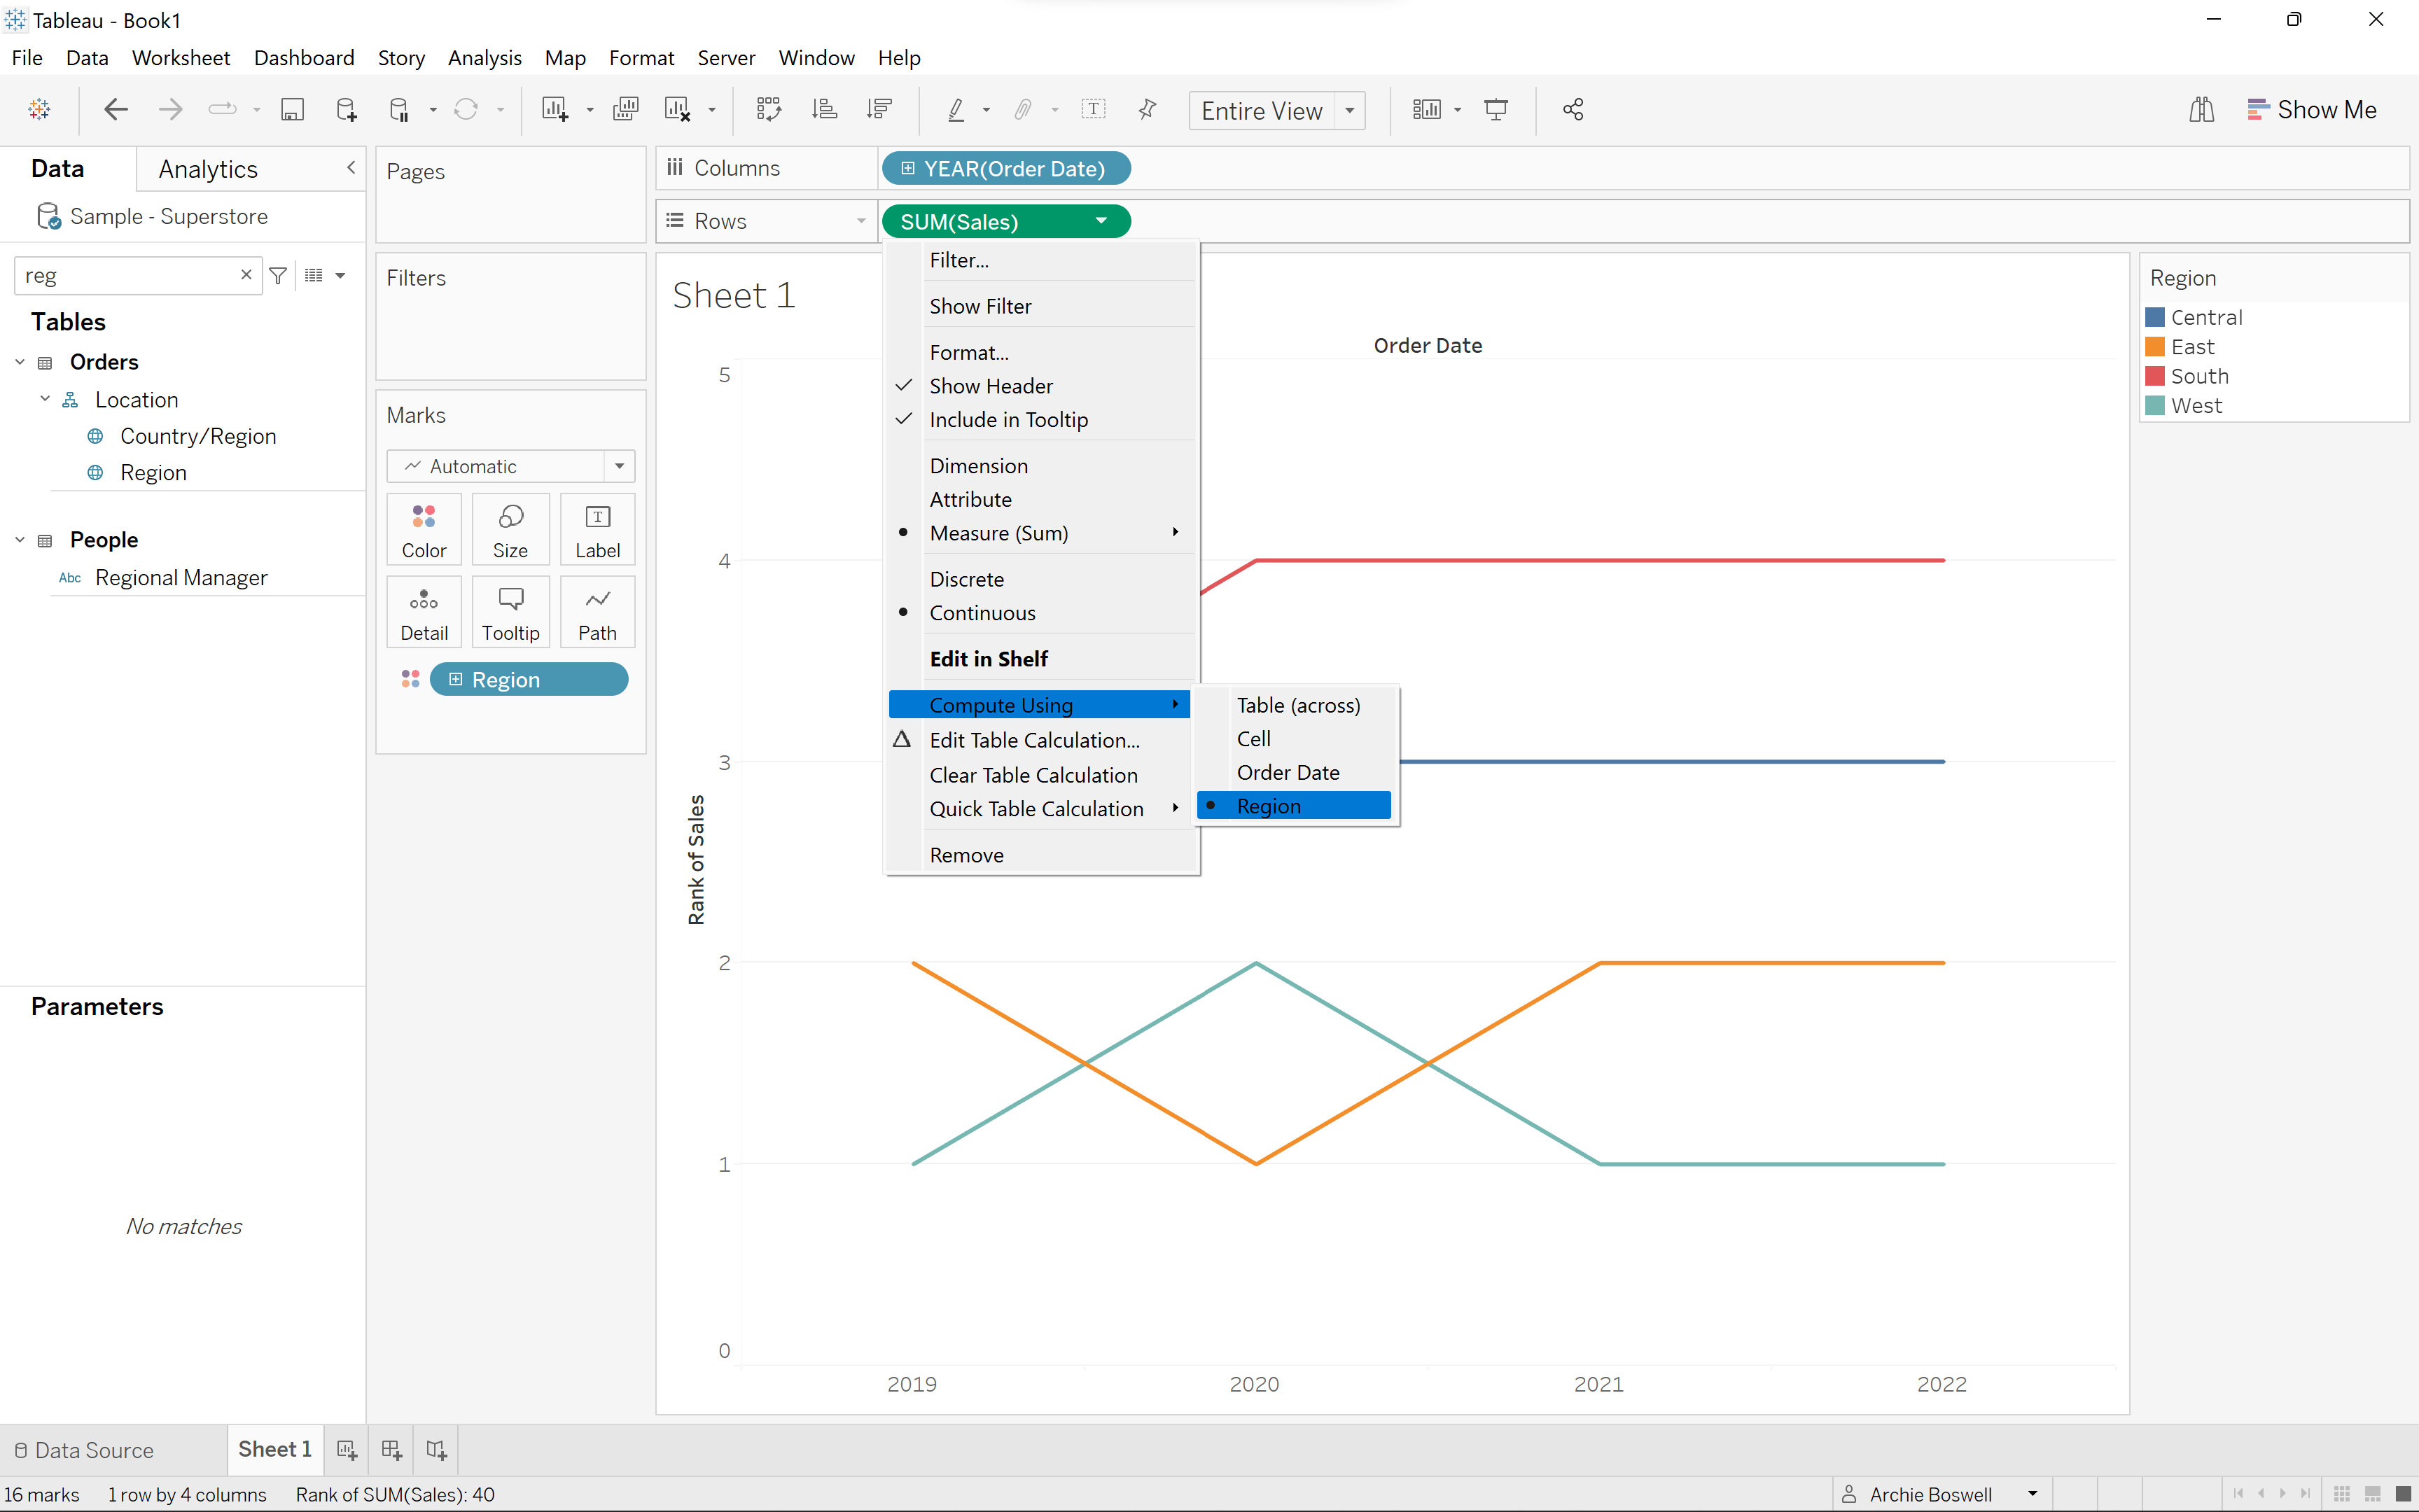
We then want to compute this at a region level of detail:
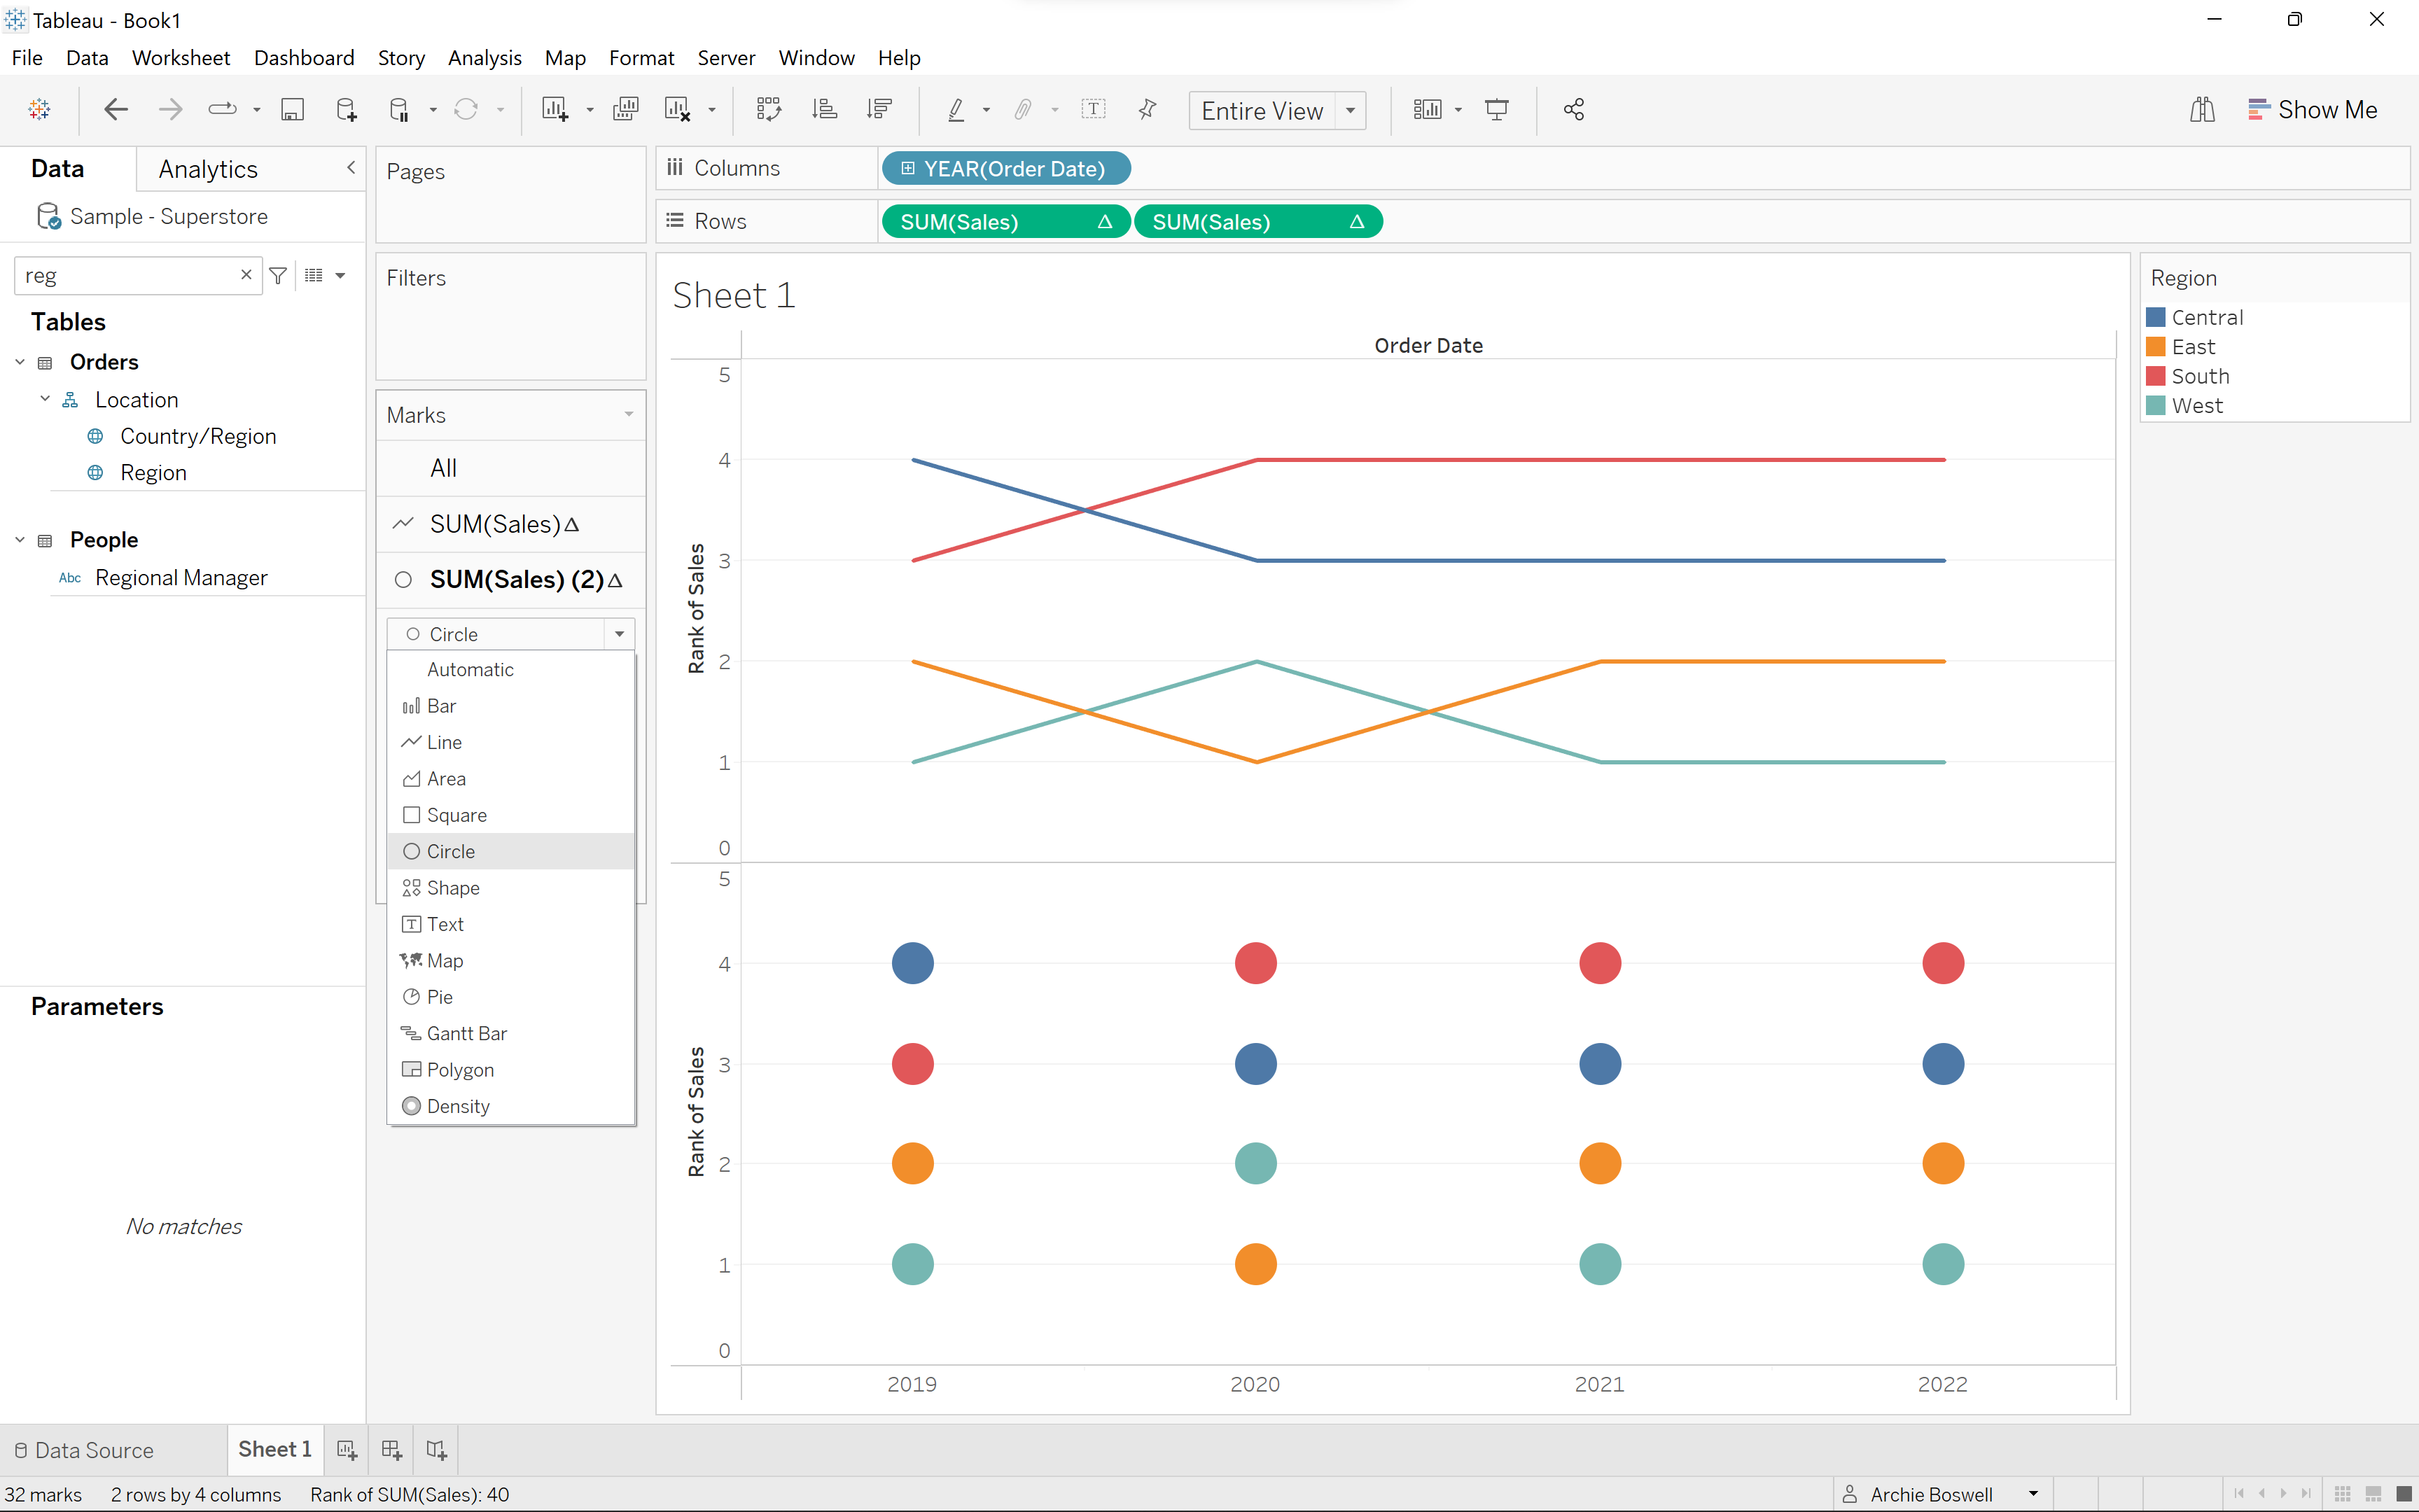
The next step is to make the corresponding nodes on another graph. To do this, duplicate the sum of sales in the rows and then change the drop down menu on the marks card for the necessary tab from automatic to circle.
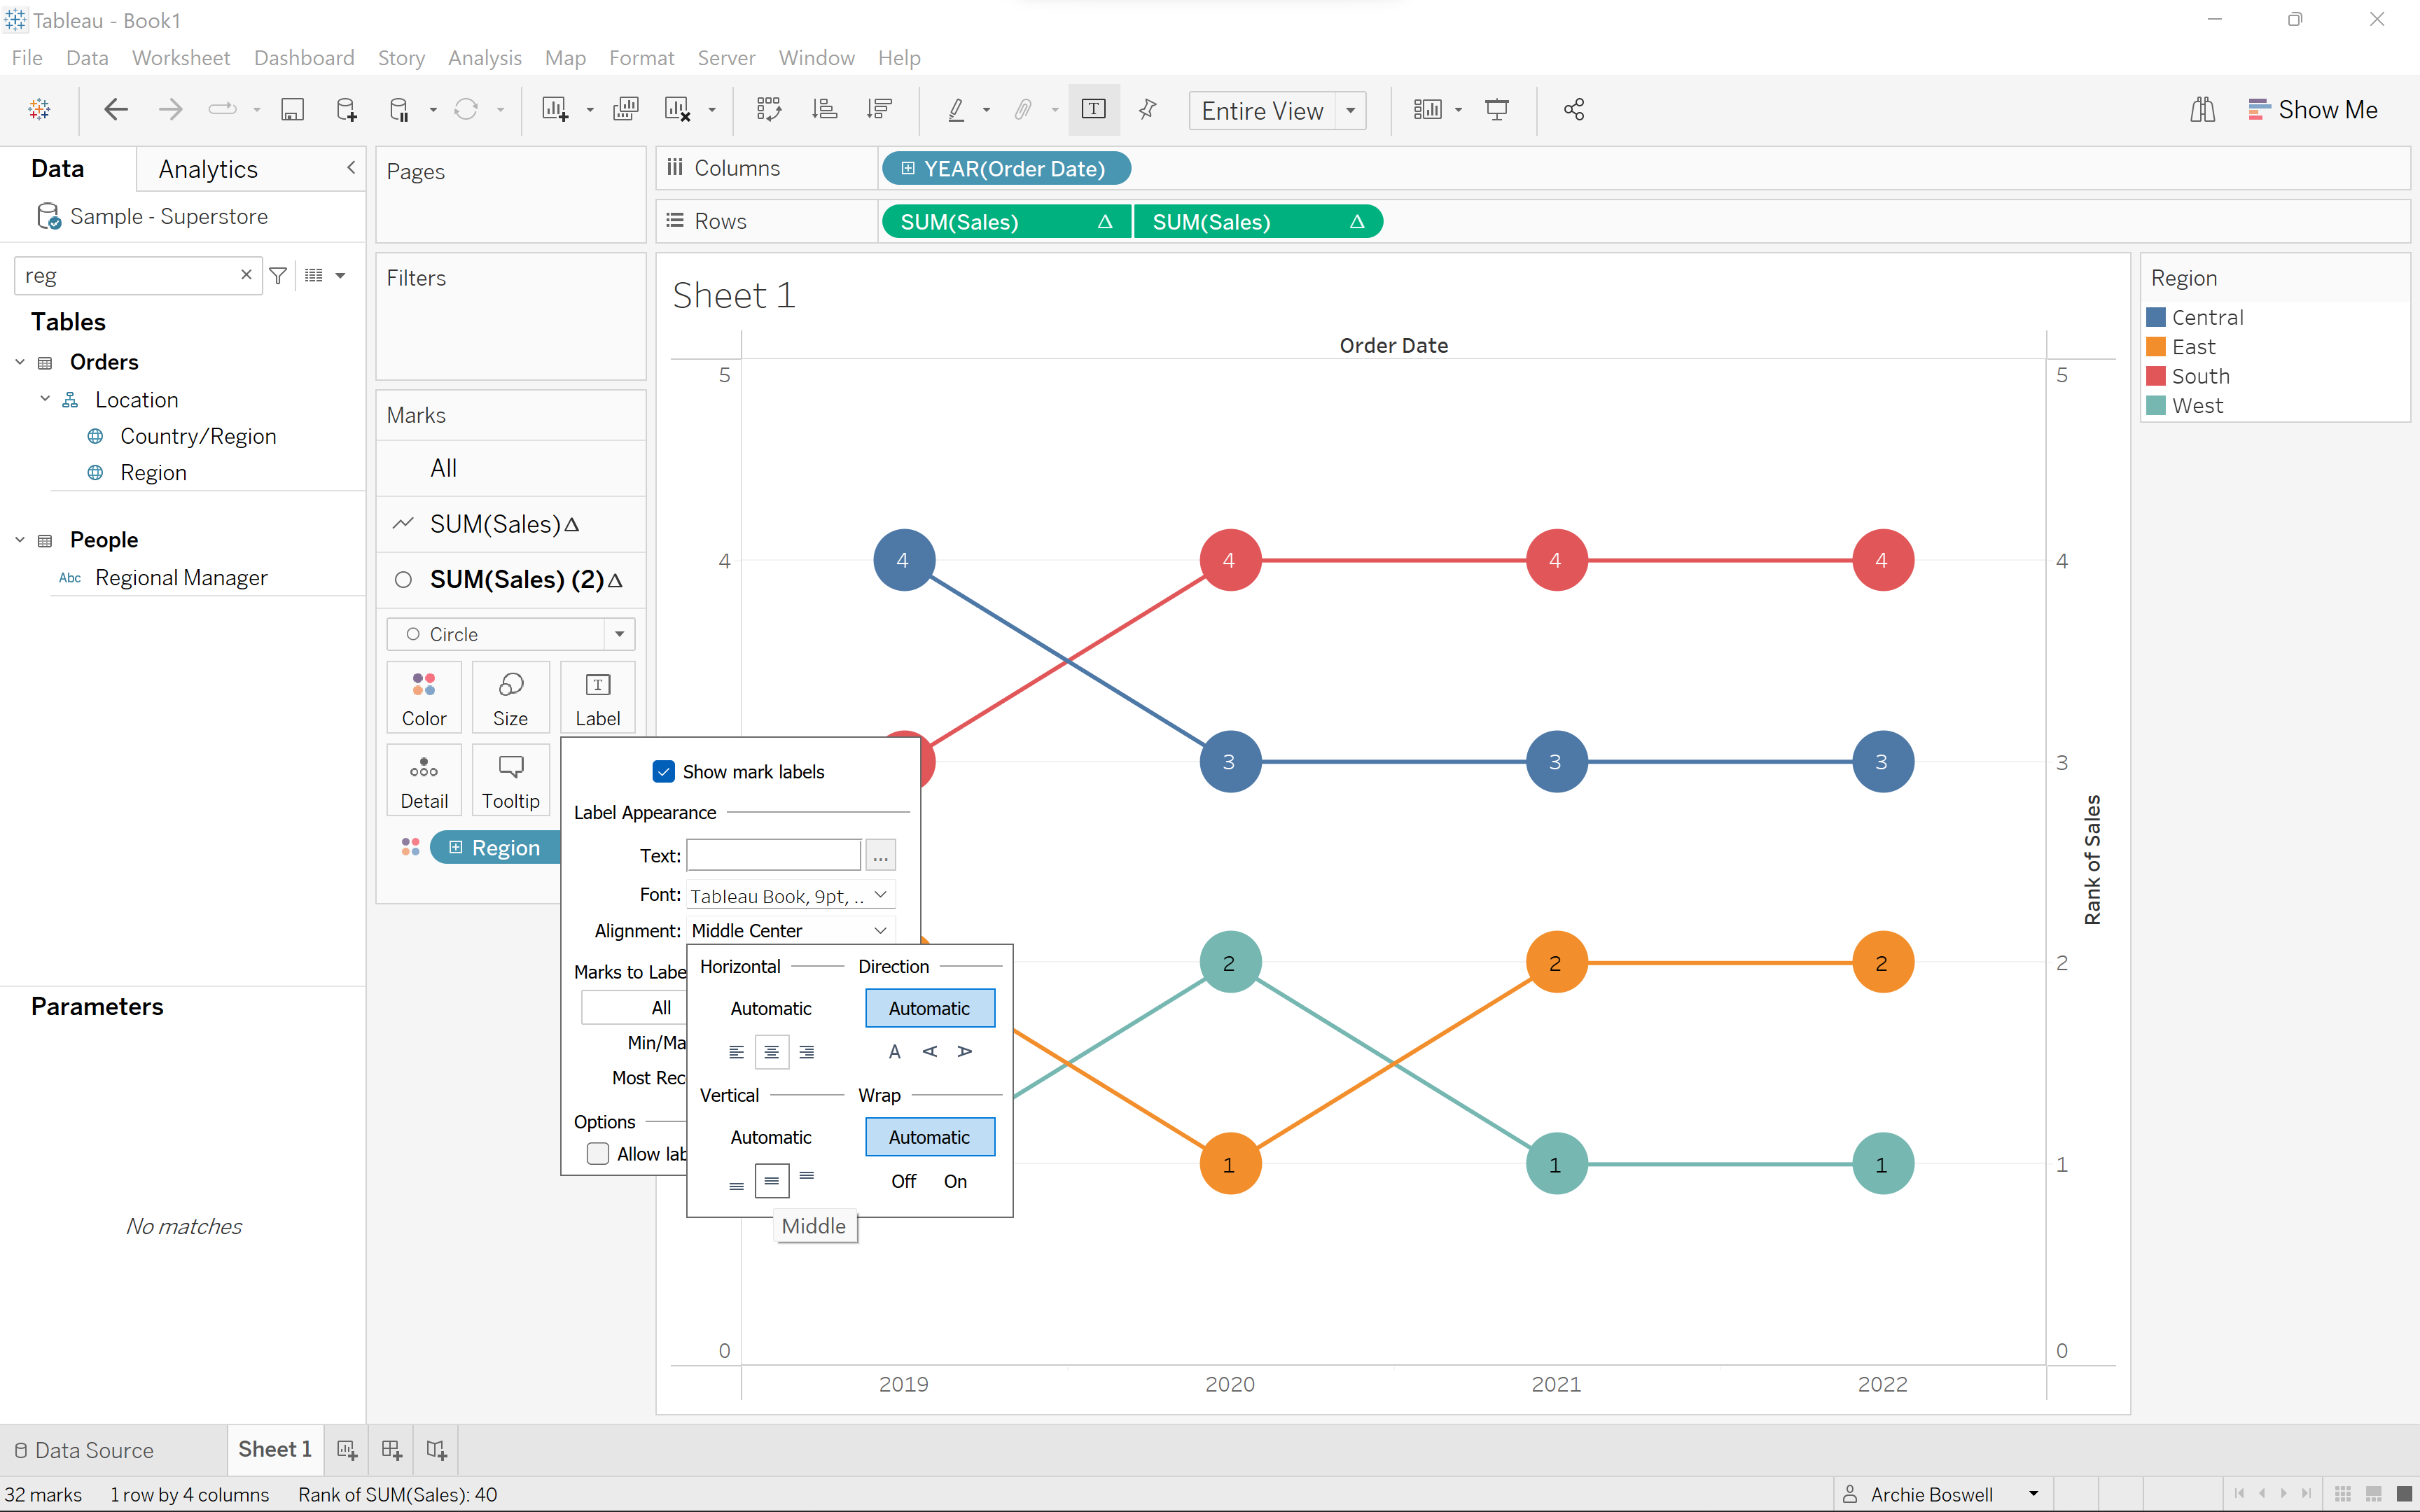
Depending on how you want your chart to look, the next steps can differ. I want the rank to be in the centre of each circle to make it very clear. Firstly, you need to right click on the axis and choose 'dual axis'- putting both the nodes and the lines on the same graph. To put the numbers in the centre of each circle, click label on the marks card and tick 'Show all labels'- choose the allignment you think looks the best.
The only thing that is left to do is to tidy up your chart, some ideas could be removing the axis headers, changing the colours or changing the opacity of the colours.
I hope this helps, feel free to include this blog in a link if you have any further suggestions or ideas!