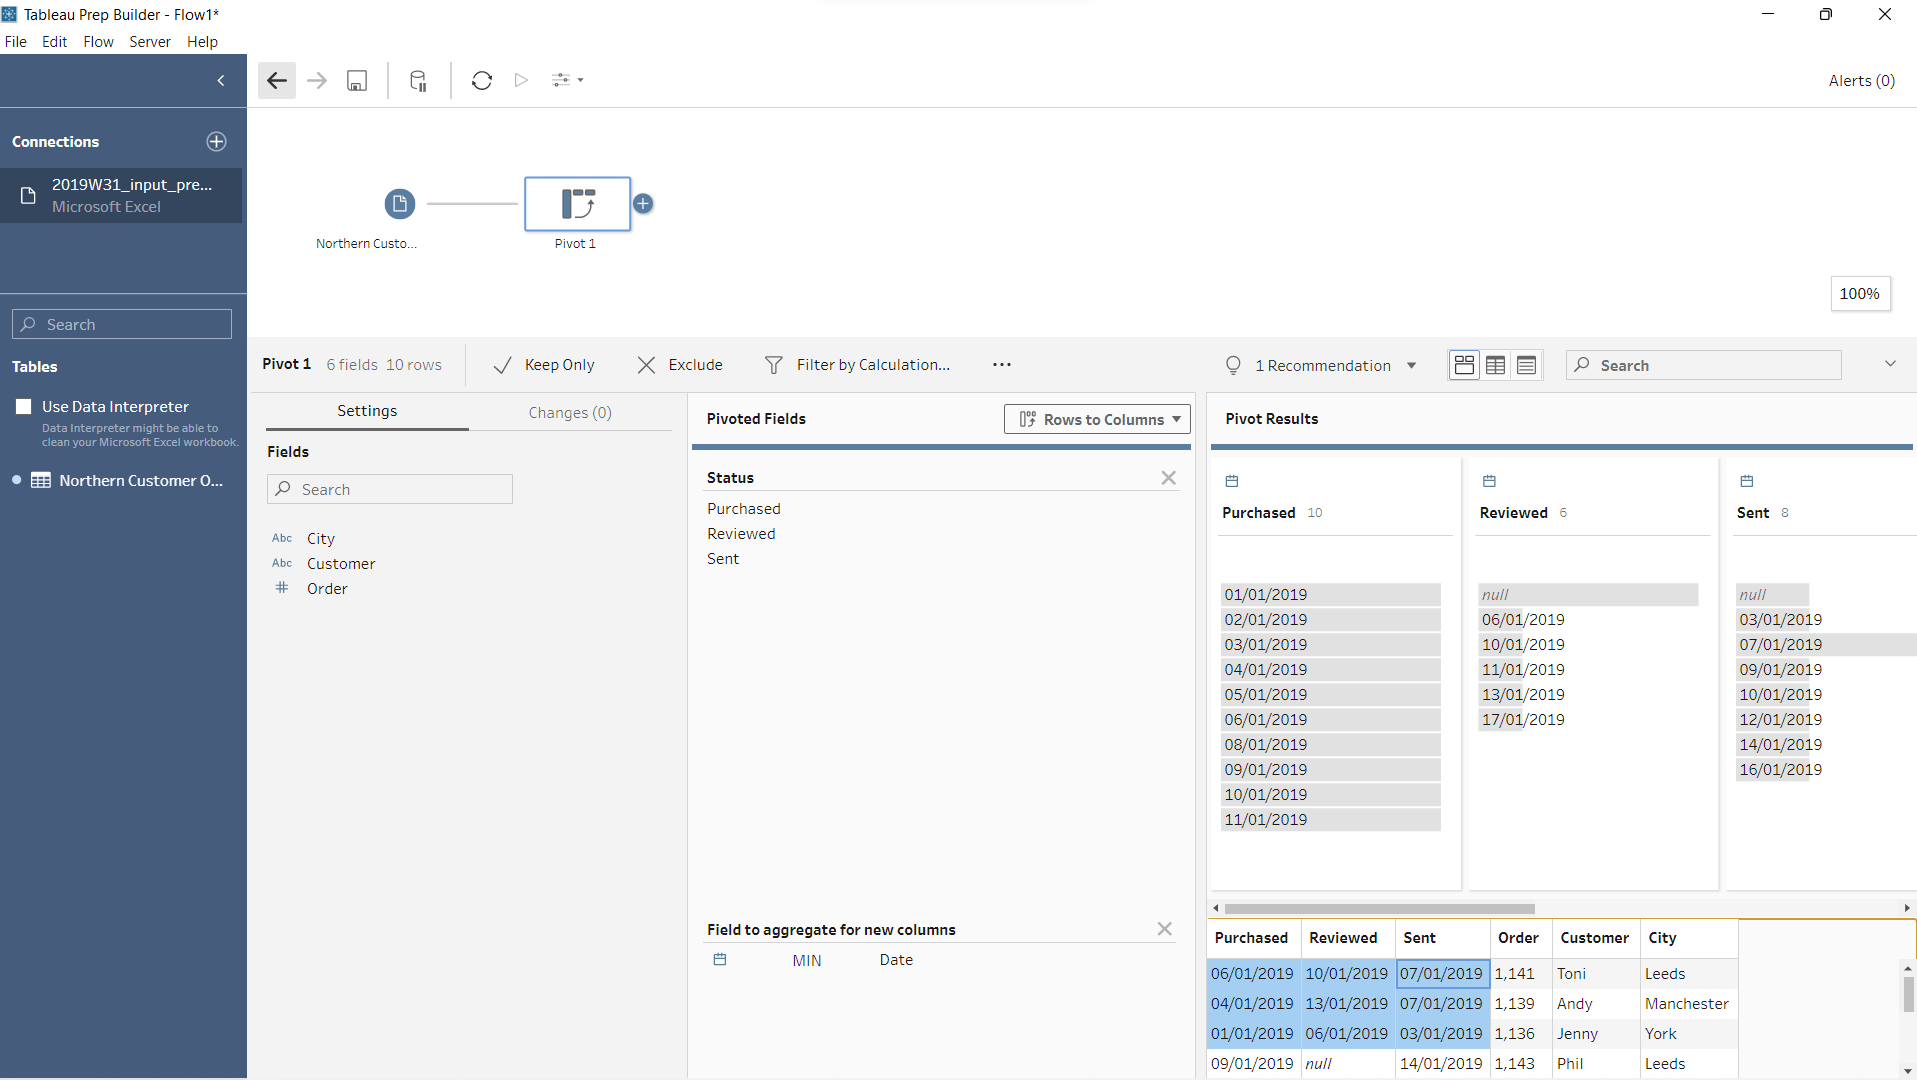
The pivot tool basically allows you to manipulate your data to make it easier to extract more information. This is done in two ways, either converting rows to columns or vice-verca.
In the following data set we will be focusing on the 'Status' field about when each order was: purchased, sent and reviewed.
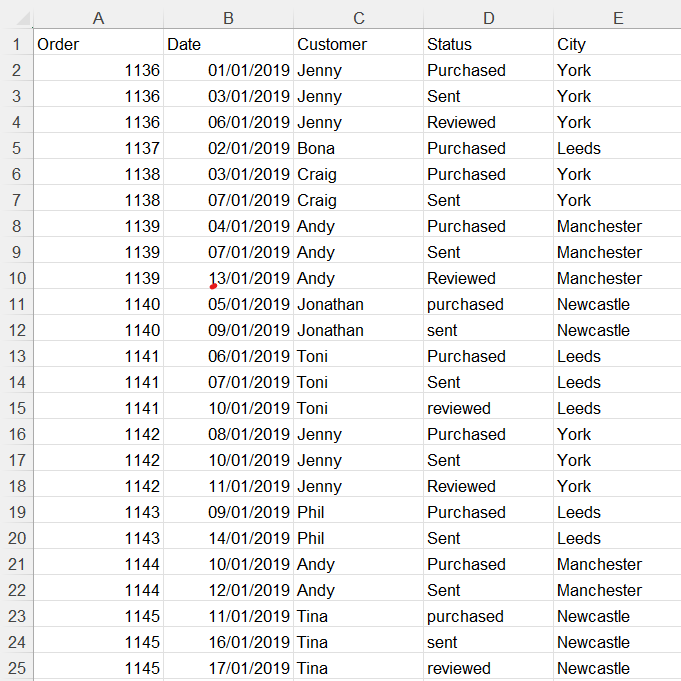
The fact that all of the responses are in one column makes it harder to extract the required information, so the pivot tool should be used to convert these rows into columns.
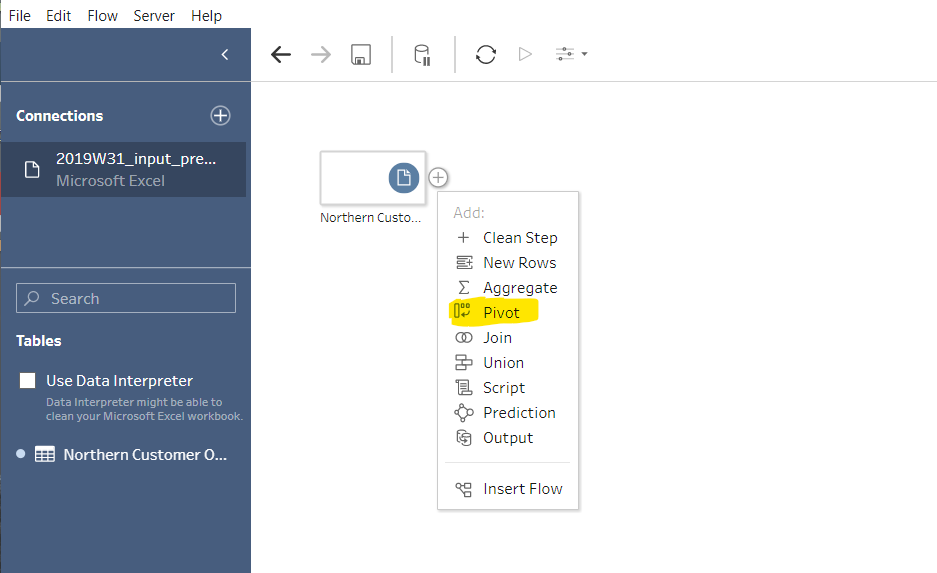
First load in the data set and click on the plus sign to get the drop down menu which includes pivot.
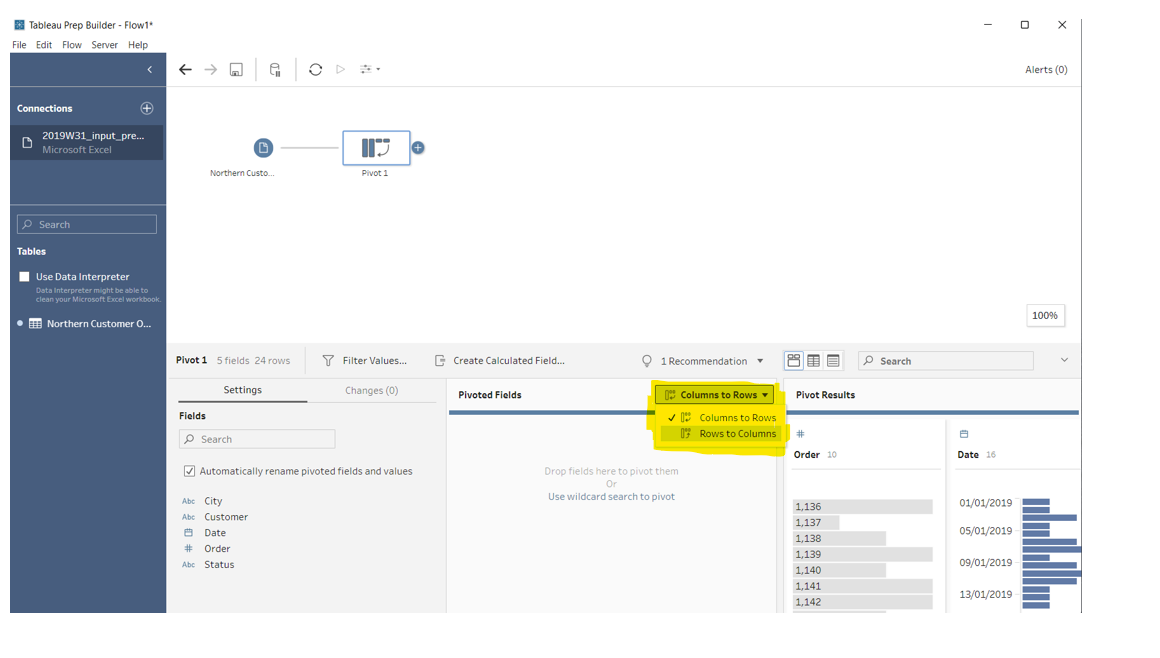
Secondly ensure that you have selected the correct way in which you are pivoting (rows to columns/ columns to rows)
After this, drag the desired field that you wish to be pivoted into 'Pivoted Fields', in our case this varaible would be 'Status'
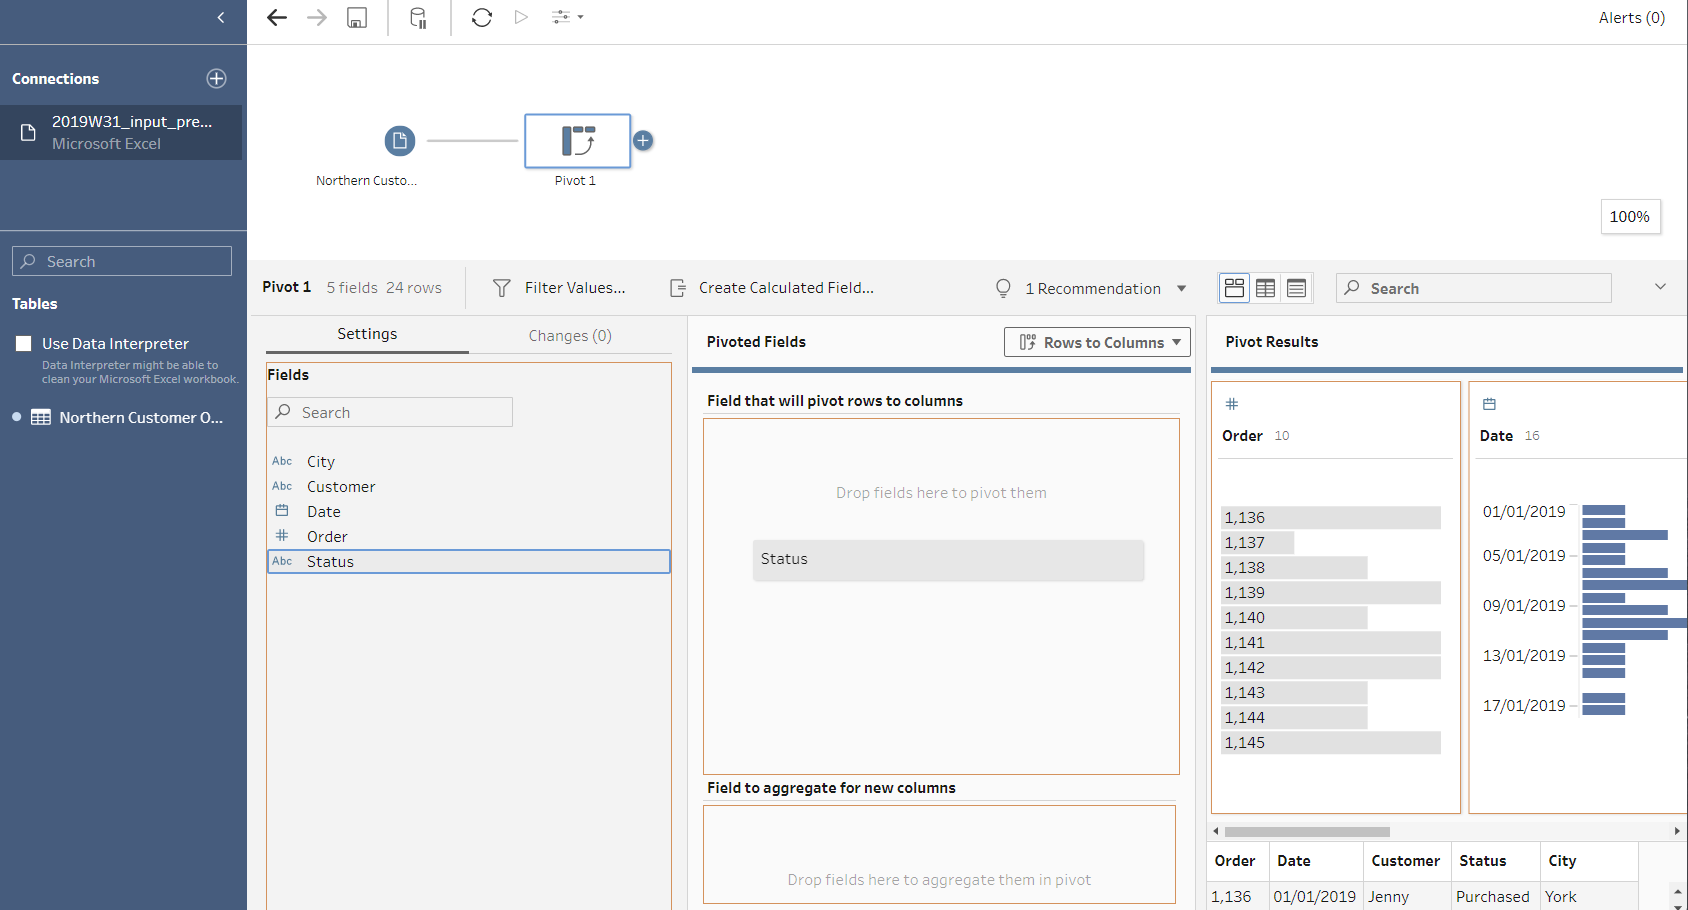
An error will appear but dont worry! This is only because you havent dragged the field to aggregate the new columns.

Seen as though we want to know the time in which the different status' occured, we want the date field in the bottom section.
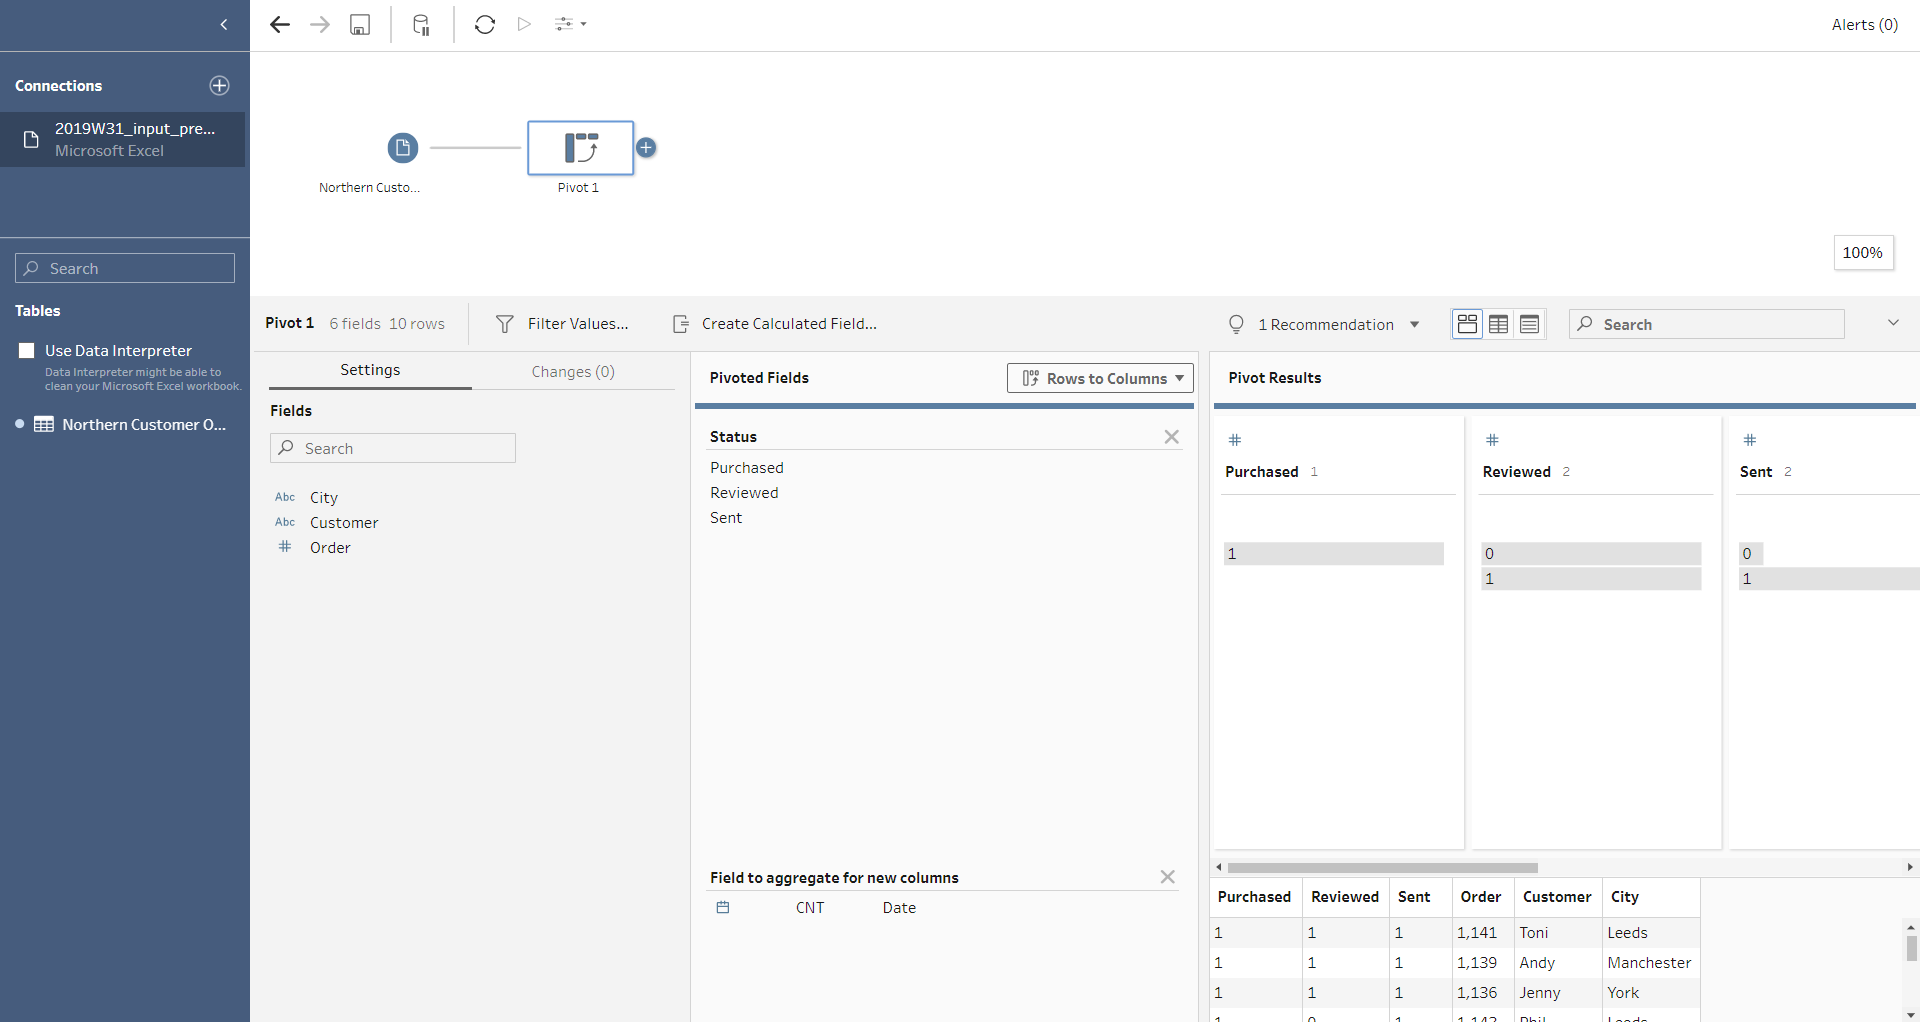
Because we are looking at dates, we need to change the 'CNT' option to MAX or MIN- this is because there is only one date in each row so MIN/MAX would suffice.
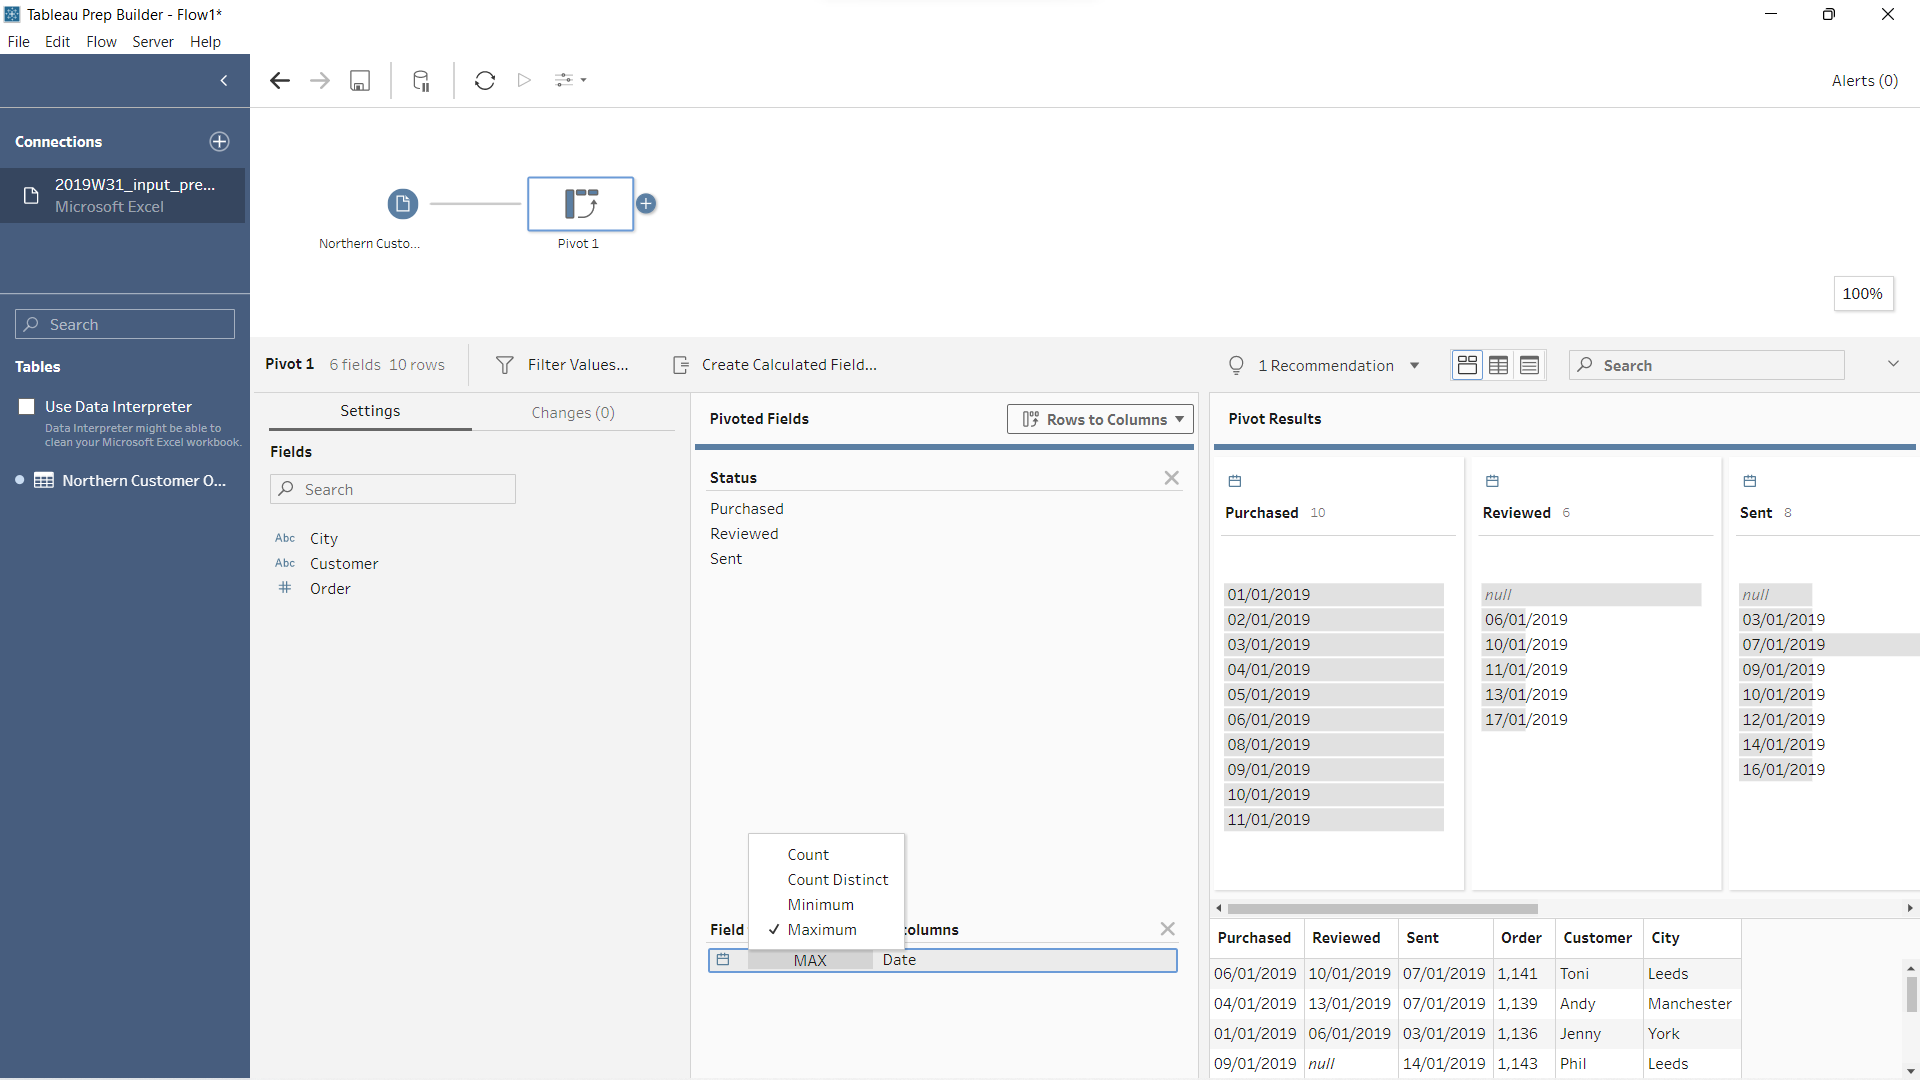
And there we have it! We have each of the responses in a column of its own.
