Hello internet people,
Anuka here, for my very first blog post I would like to tell everyone about how to create hover graphs.
What on Earth are hover graphs you may ask, well that would be a very good question. Chances are they’ve been done before but all I know is that I came to our Cool-Cat-Coach and Tableau Zen Master Andy Kriebel with an idea and he created it in under a minute and I think it works really well. And I am now going to pass on that knowledge to you. Go forth and multiple my hover graphers!
What are Hover Graphs?
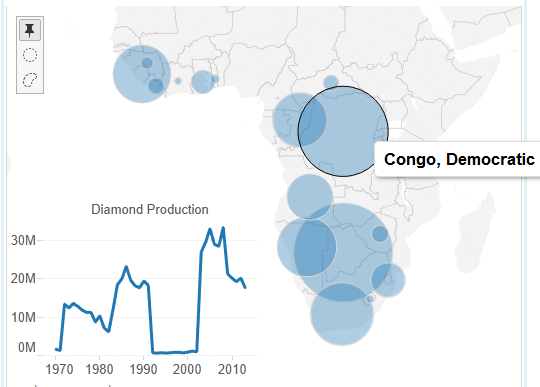
It’s a graph or sheet that pops up when your mouse hovers over another field in a sheet in your dashboard.
Really simple to do, effective and space-saving.
Demo
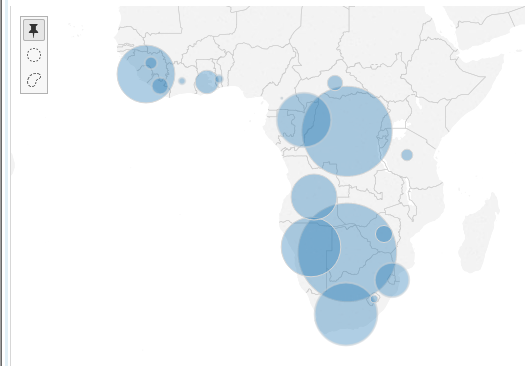
 Not hovering, no graph, not awesome
 Hovering, hover graph, awesome
How to do it
Firstly you will need two sheets dragged into a dashboard, the sheet you want showing all the time (in the example it was the map of showing Africa) and the hover graph sheet (diamond production over time). You want them both already on the dashboard so they’ll show up when it’s time to do your filter action.
Go to:
Dashboard menu
Actions…
Add Action > Filter…
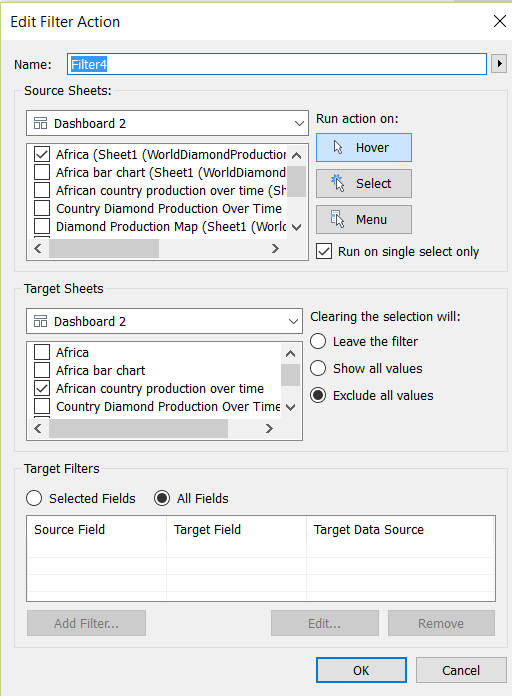
Choose your permanently seen sheet as the Source Sheet (uncheck others)
And choose your hover graph sheet as your Target Sheet (uncheck others)
Run action on: Hover
Check the “Run on single select only” box
Clearing the selection will: Exclude all values
Target filter: All fields
DONE. Click OK. Click OK again.
Your dialog box should look something like this:

Now check your hover action.
Move your hover graph sheet to where you want it.
Hide any titles it may have so the hover graph box should look invisible before you hover over an intended field.
To hide title:
Right click hover graph box
Hide Title
And voila, you’re done. Enjoy your hover graphing.
Aloha! Adios! Auf Wiedersehen!
Anuka
