Interactive Proportional Brushing
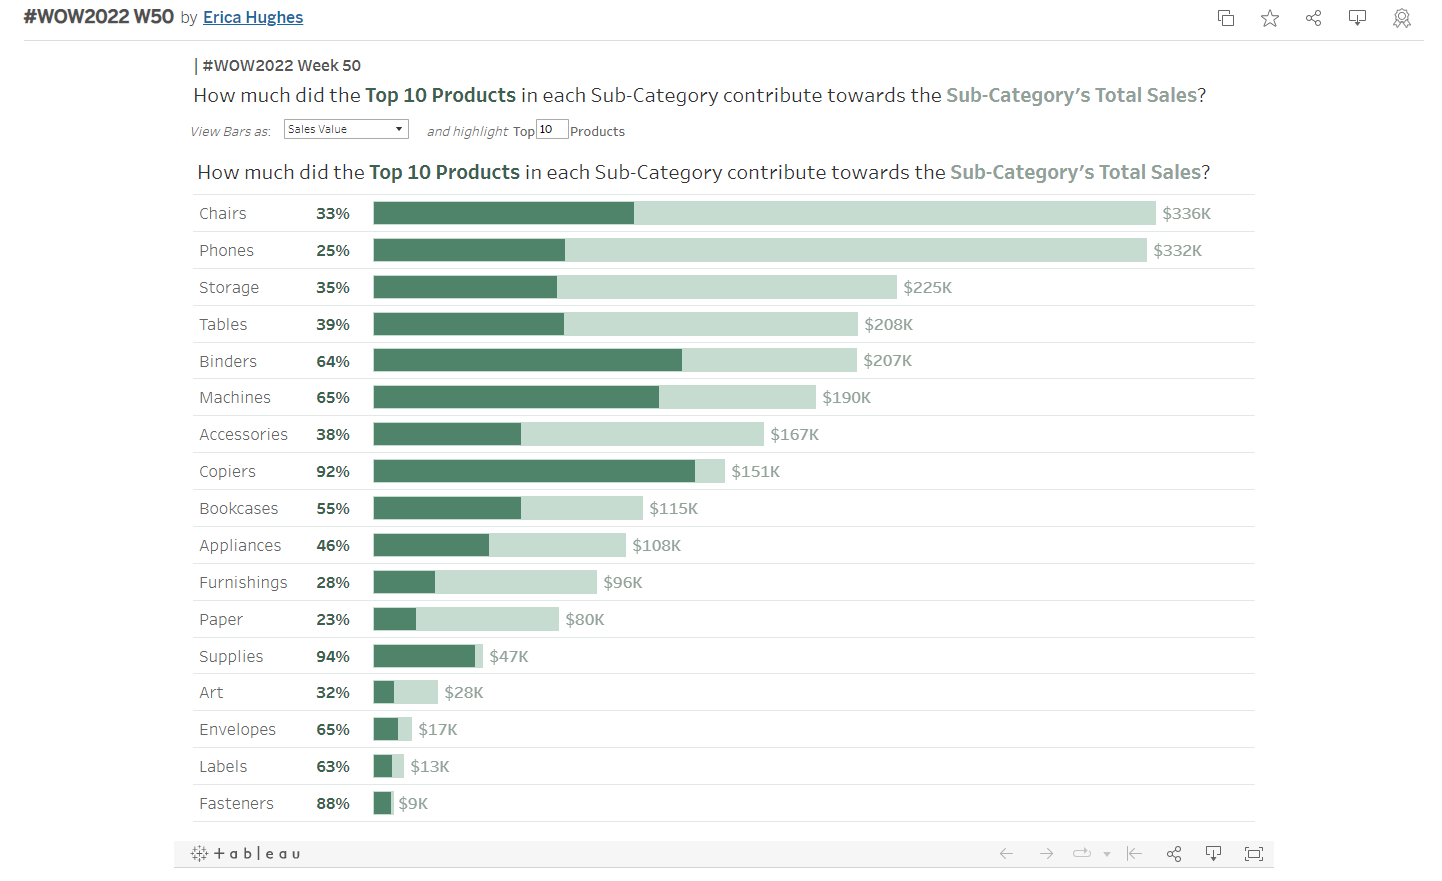
From https://www.workout-wednesday.com/2022w50tab/
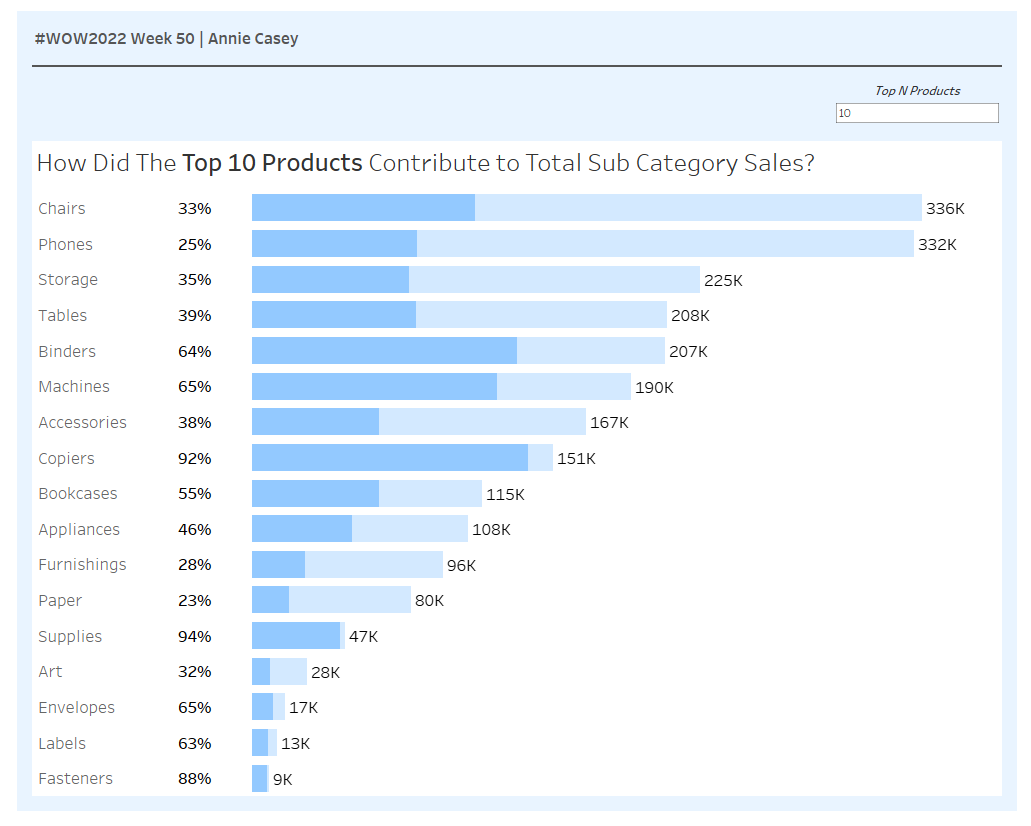
Goal: How did the top N products in each subcategory contribute to total subcategory sales?
First I wanted to figure out how to find the top N within a subcategory. Creating a set based on sum of sales did not accomplish the top N product sum of sales within a sub category, instead it would only return the top N subcategories by sum of sales. I found a helpful blog using INDEX() to accomplish the Top N products within a subcategory:
https://kb.tableau.com/articles/howto/finding-the-top-n-within-a-category?lang=en-gb
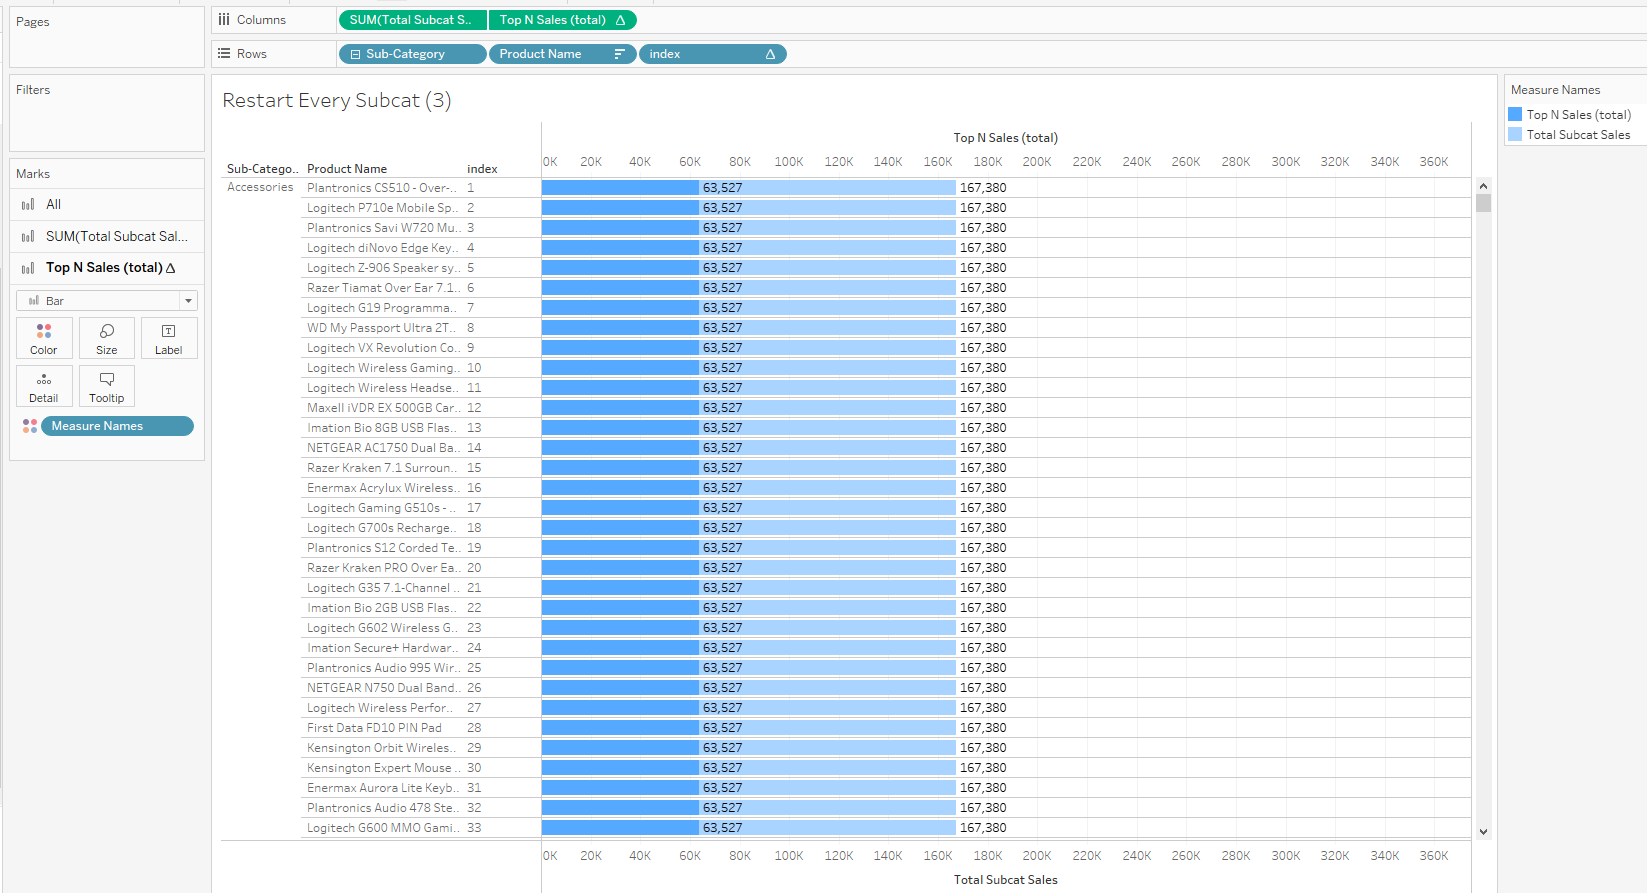
This helped make progress towards my end goal but it wasn't the final answer, the below screenshot shows how I used index() to create a Top N Sales calculated field. The Viz is looking more accurate but the orange bar for each subcategory is split out by each product name, I want this to be a single number for the "Top N Products Sales" within a subcategory:
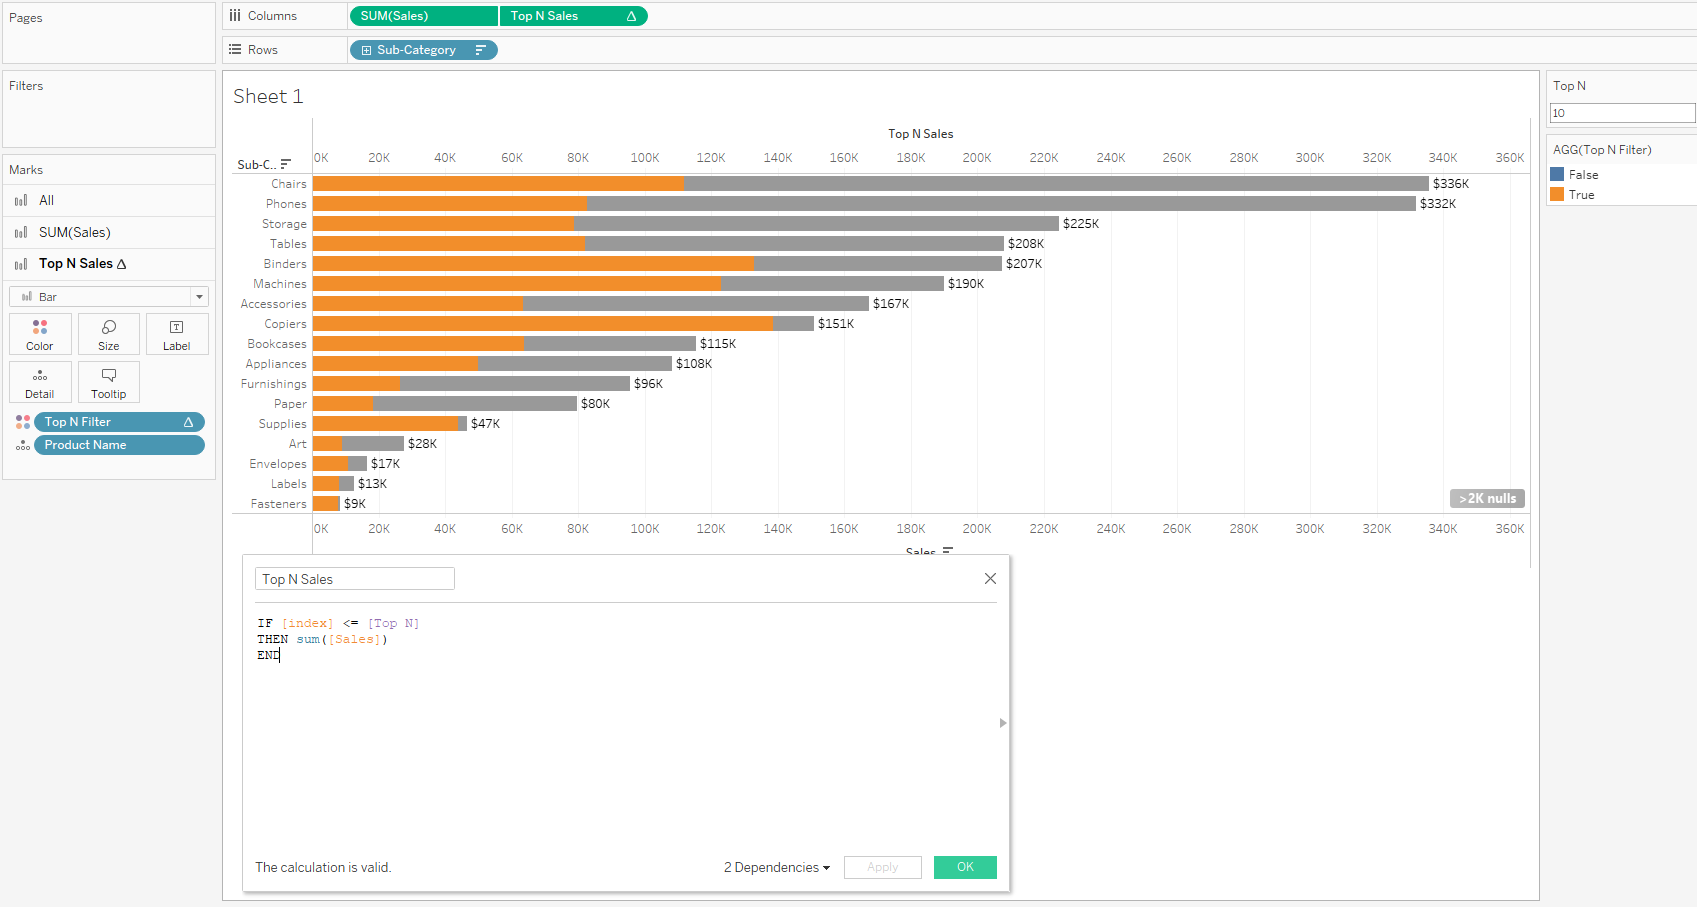
To try and get a total of the Top N Product Sales I tried using TOTAL() but got the error of "The input to TOTAL() cannot be a table calc" so it turns out this is when I would pivot to use WINDOW_SUM() - It was encouraging to see that Sean Miller had the same thought process in his youtube solution:
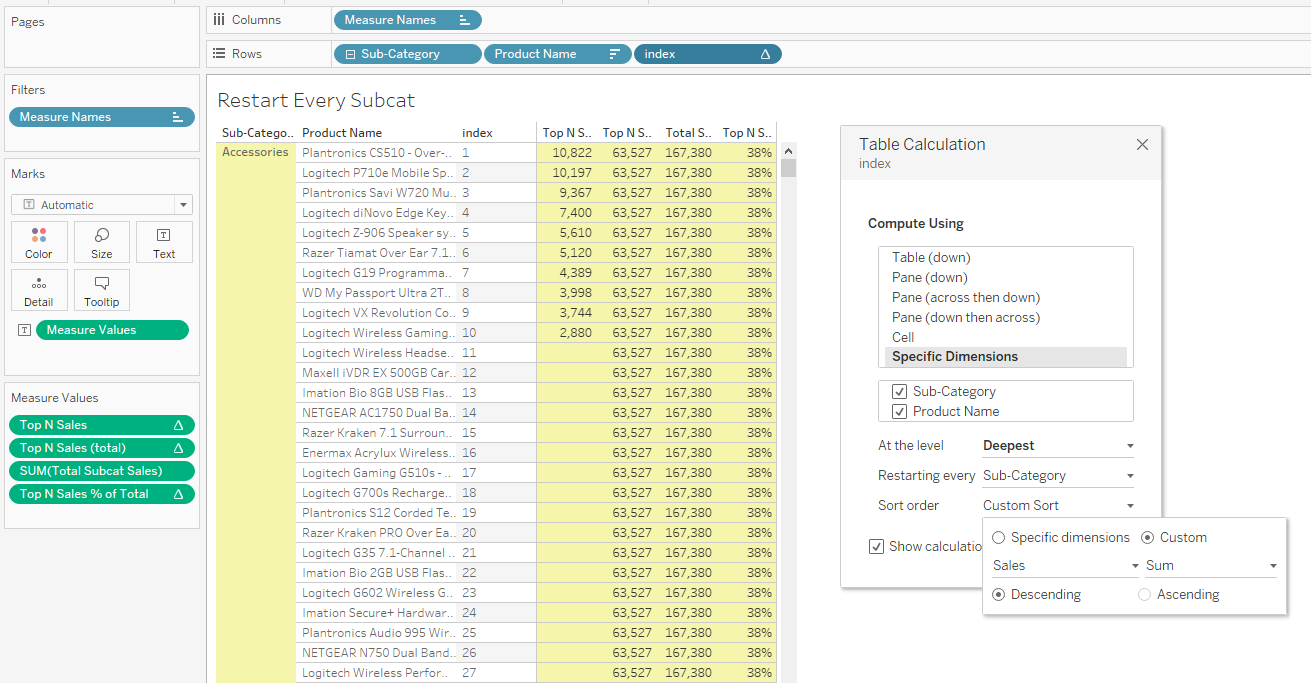
In order to show the total sales for the top N products, the total sales for the subcategory and the % of total sales, I needed to set up 3 calculated fields that are configured to restart at every subcategory:
Top N Sales (total): WINDOW_SUM([Top N Sales])
Total Subcat Sales: { FIXED [Sub-Category]: SUM([Sales])}
Total N Sales % of Total: [Top N Sales (total)] / sum([Total Subcat Sales])
Depending on the Top N Parameter value, I want the same Top N Sales value and Total Subcat Sales value to be consistent for each subcategory which will then make calculating the % of Total easy for each subcategory. Index and Top N Sales need to be table calculations configured to restart every subcategory and sorted by sum of sales descending:
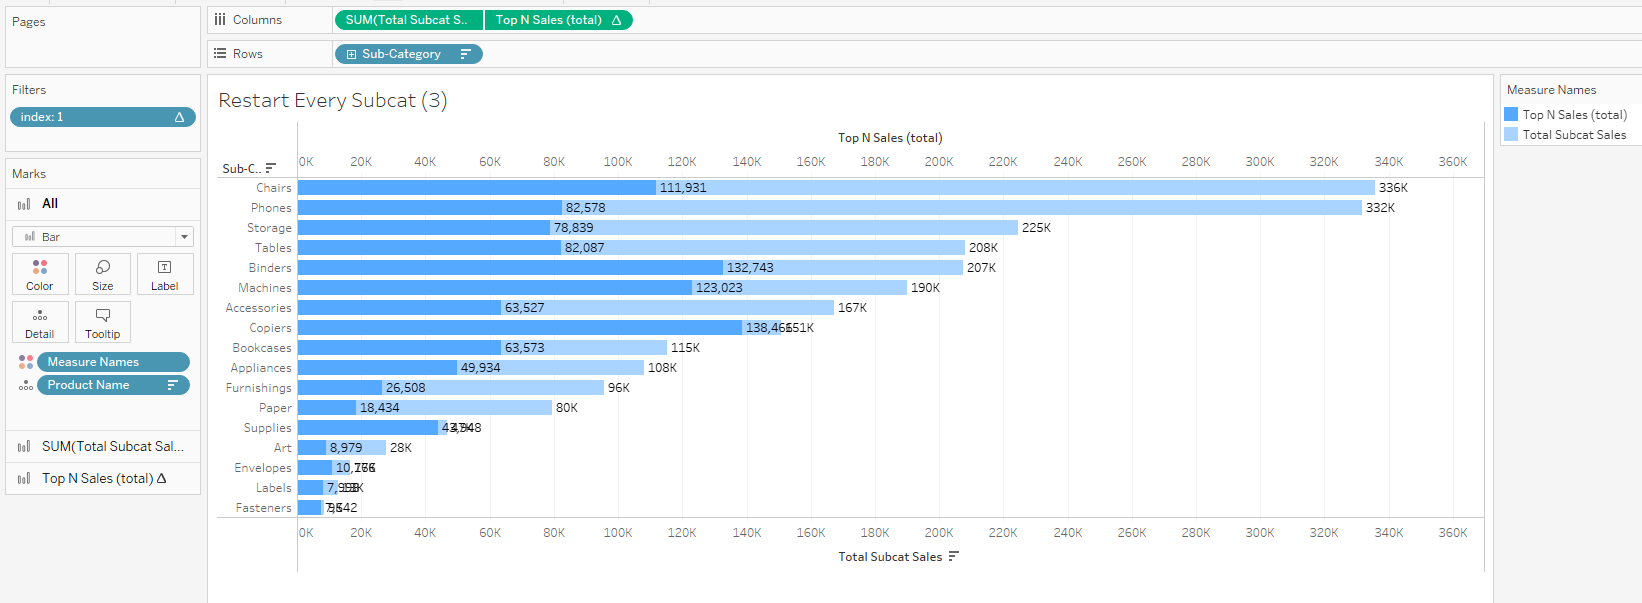
Now I know how to configure my calculated fields correctly, I can begin transforming my data table into a dual axis bar chart:
Things to note:
-Because we configured Total Subcat Sales and Top N Sales (total) to be consistent within a subcategory, we have the exact same bar charts for each Product Name / Index. To get one bar per subcategory, we will need to remove product name and index from the viz.
-Dragging Product Name off of the viz will throw an error because the INDEX field (and thus Top N Sales (total)) needs Product Name to work properly. The solution to this is to drag Product Name off of Rows and onto Detail so that INDEX can still reference it without each individual Product Name showing in the rows.
-For Index, dragging it onto detail like we did for Product Name will remove it from the viz but will incorrectly sum values for all indexes in a given subcategory, severely inflating the total numbers. After peeking at the solution workbook, I saw Erica had her index field on Filters and filtered to just the 1st index. This makes sense since we've confirmed each bar is the same for every product / index in a subcategory, so we are simply just filtering to show 1.
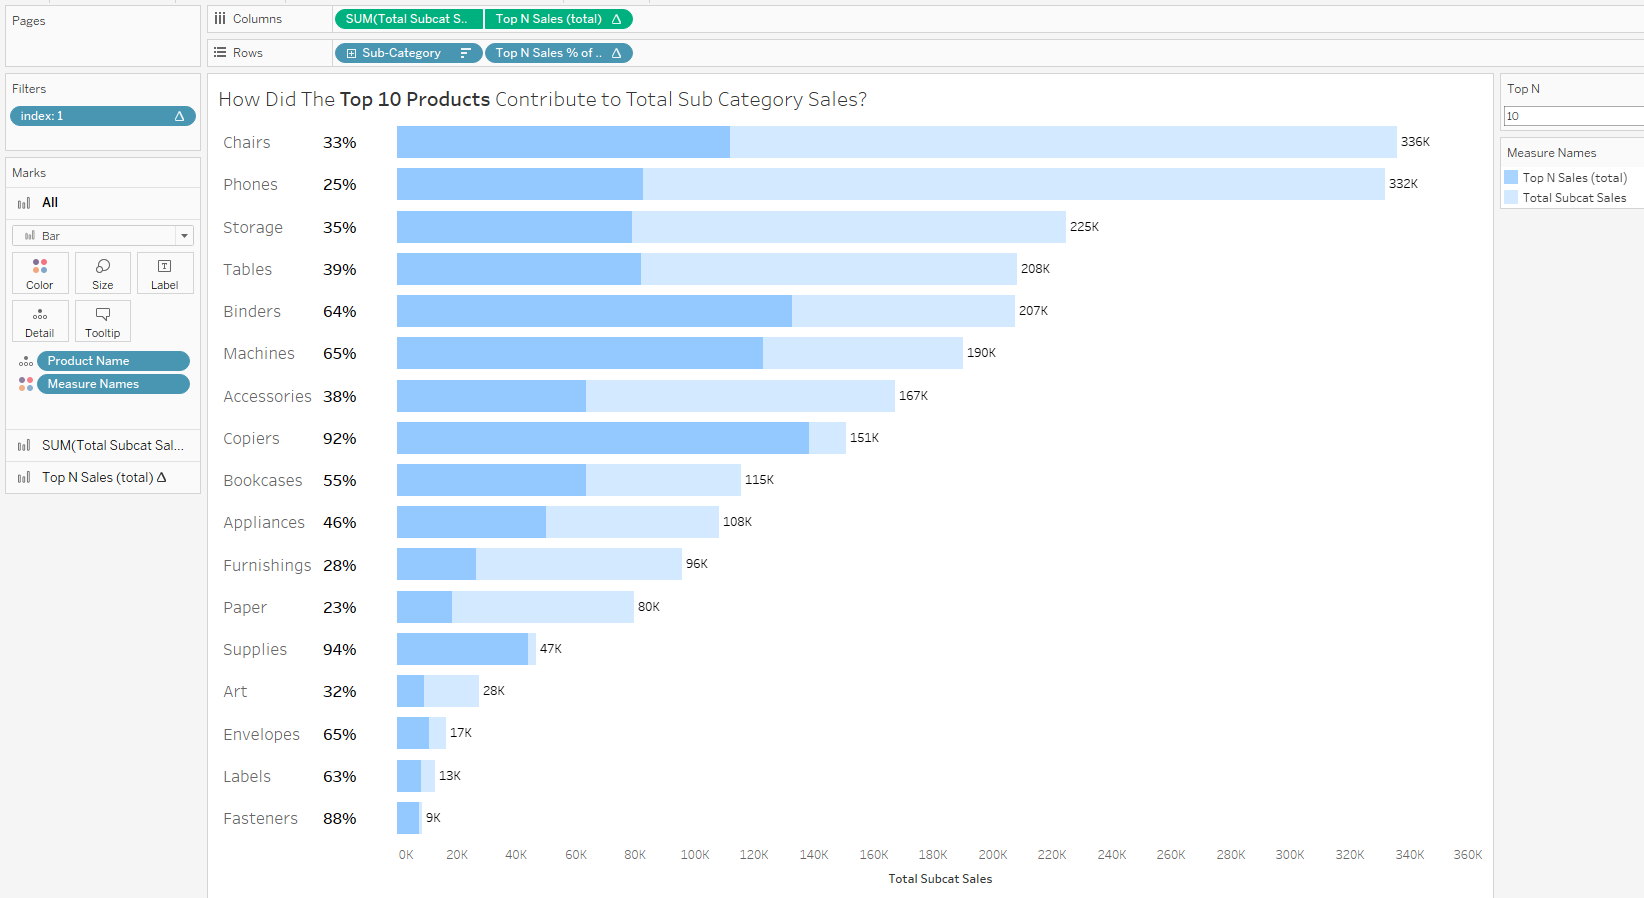
FINAL PRODUCT:
https://public.tableau.com/app/profile/annie.casey/viz/WOW2022WEEK50-AnnieCasey/Dashboard1