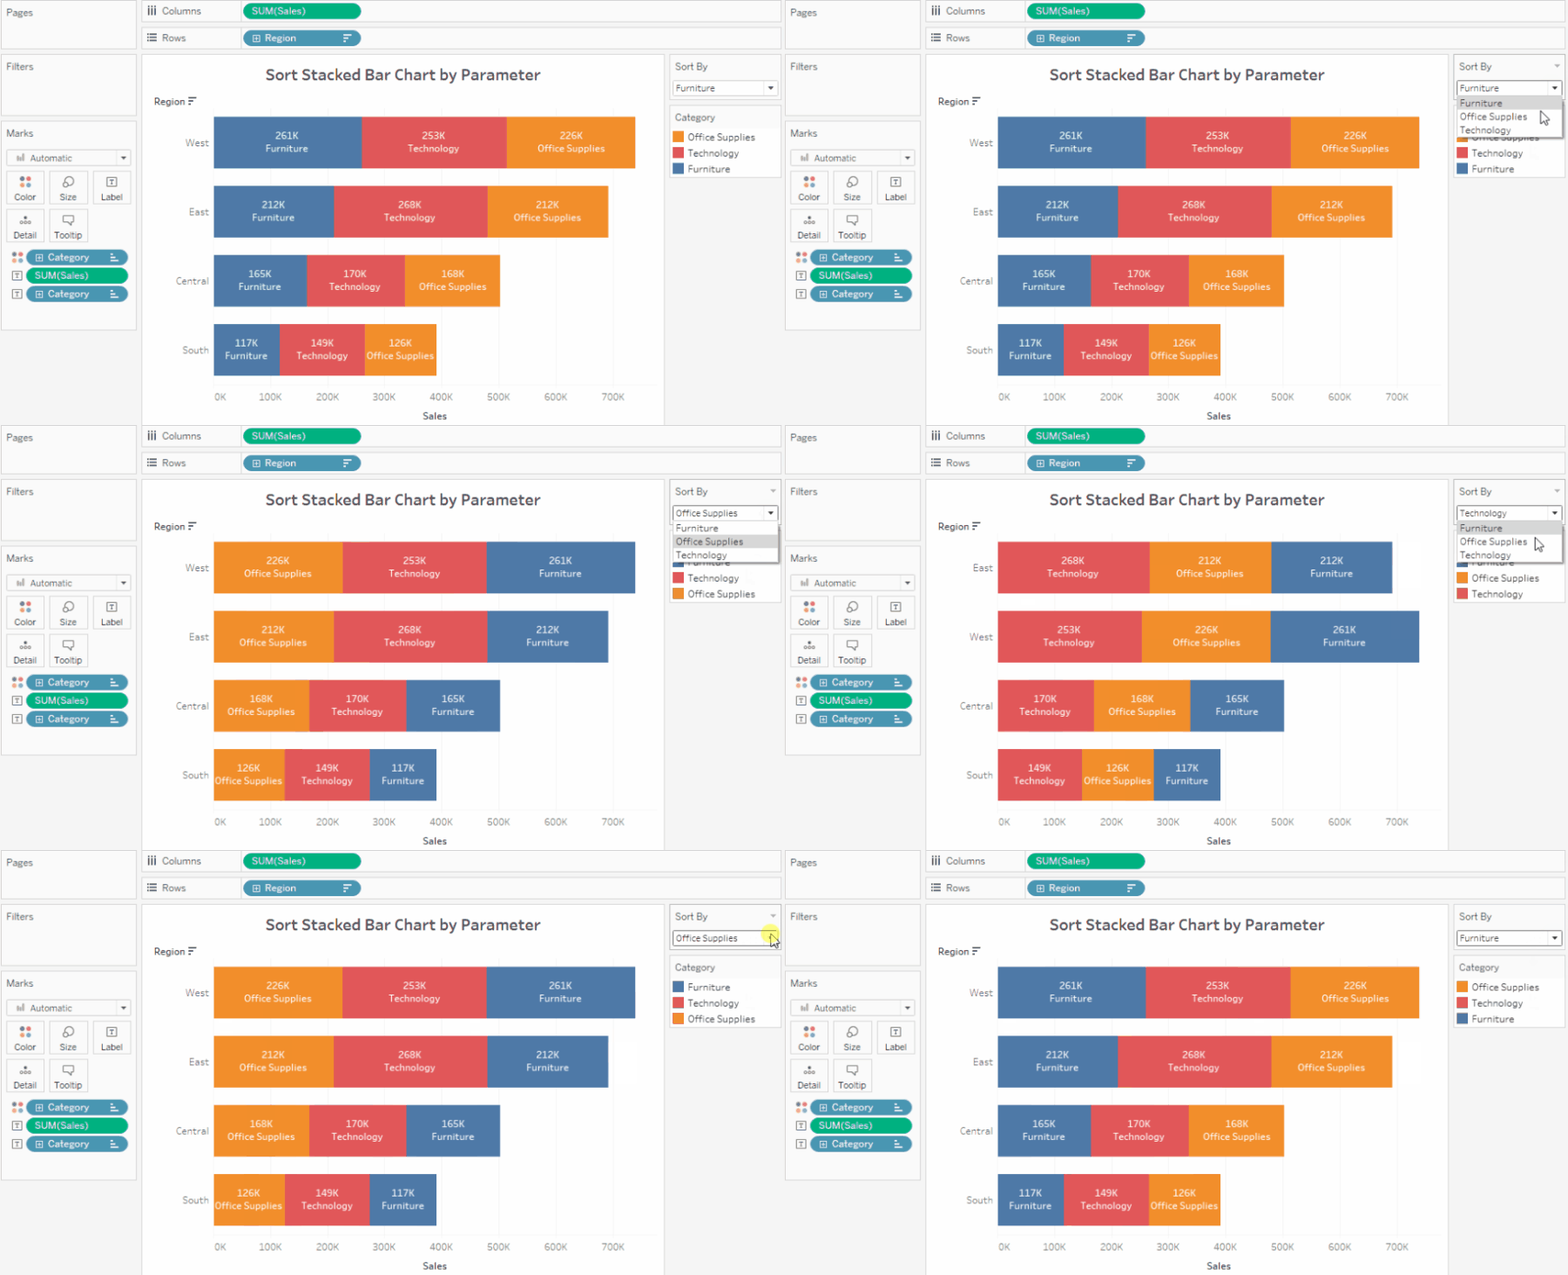
Stacked bar charts can be very useful and even more useful when they are built to be dynamic.
Below you will find the steps and Youtube tutorials used to change the sort of a stacked bar chart based on the parameter selection.
(hint: you'll need a sort on the measure on rows and a sort on the measure on color with two different calcs)

TUTORIALS:
Step 1:
How to sort sales by selected parameter: https://www.youtube.com/watch?v=-WRQcGiyZog
1. Create Parameter for all sort options
Ex. [Sort By] is a parameter containing all category options
2. Create Calculated Field: IF [Field] = [Parameter] THEN [Value] END
Ex. [sales of selection] is a calculated field:
IF [Category] = [Sort By] THEN [Sales] END
---This calculated field will only return the sales of the selected category
3. Sort field on rows by this calculated field (this will force the sort to only consider the selected category's sales)
Ex. sort: [Region] by SUM of [sales of selection] descending

Step 2:
How to have selected parameter show first in stacked bar: https://www.youtube.com/watch?v=UcHBd5VMipY
1. Create Calculated Field: IF [Field] = [Parameter] THEN 1 ELSE 0 END
Ex. [selection first] is a calculated field:
IF [Category] = [Sort By] THEN 1 ELSE 0 END
---this calculated field returns 1 for the selected category and 0 for the rest of the options
2. Sort field on color by this calculated field (only one option will be assigned 1 and the rest will follow)
Ex. sort [Category] by AVG of [selection first] ascending

Done!
