On day 3 of dashboard week we were given the task to connect to the Rick and Morty API: https://rickandmortyapi.com/documentation/#introduction
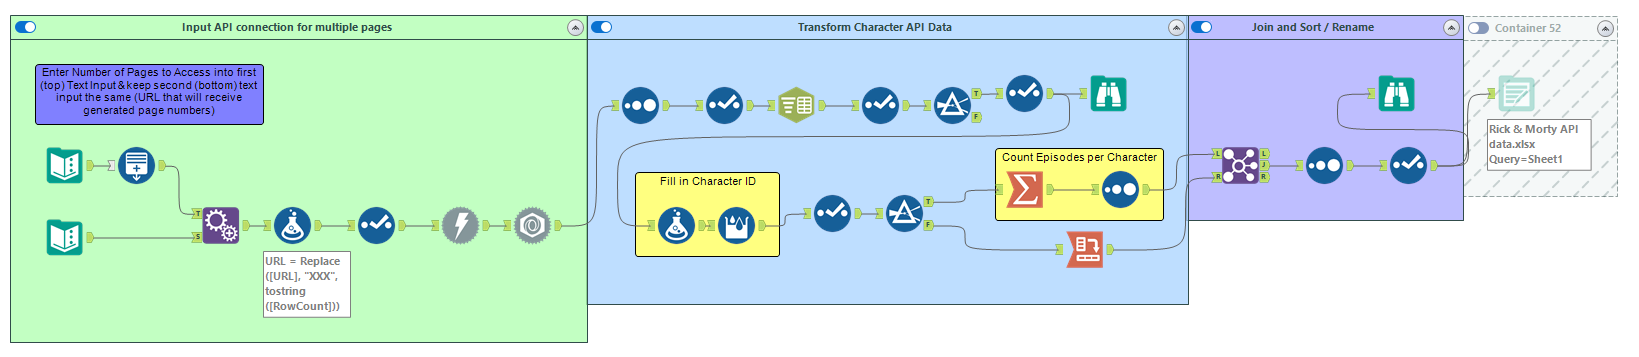
My Alteryx Workflow can be seen below.
Data Input / Connection:
I started off by needing to paginate in order to access all 42 pages within the characters API. I solved this by creating a text input that contains the number 42 (this can be changed to limit the number of pages) paired with a generate rows tool that creates an output of 42 rows labeled 1 through 42. I then used this to append to the API URL and create a unique URL for each of the 42 pages. Lastly I used the Download and JSON Parse tools to access the 42 pages of data through the API.
Data Cleaning / Transforming:
Before using the Cross Tab tool to pivot my downloaded data, I used a formula and multi row formula tool to create a new column called 'Character ID'. I filtered out the columns defining episodes where each character appeared in and replaced it with the count of episodes for each Character Id using the Summarize tool and then joining it back onto the pivoted filtered data.
After a quick sort and reformat of the column headers, the data was ready for output.
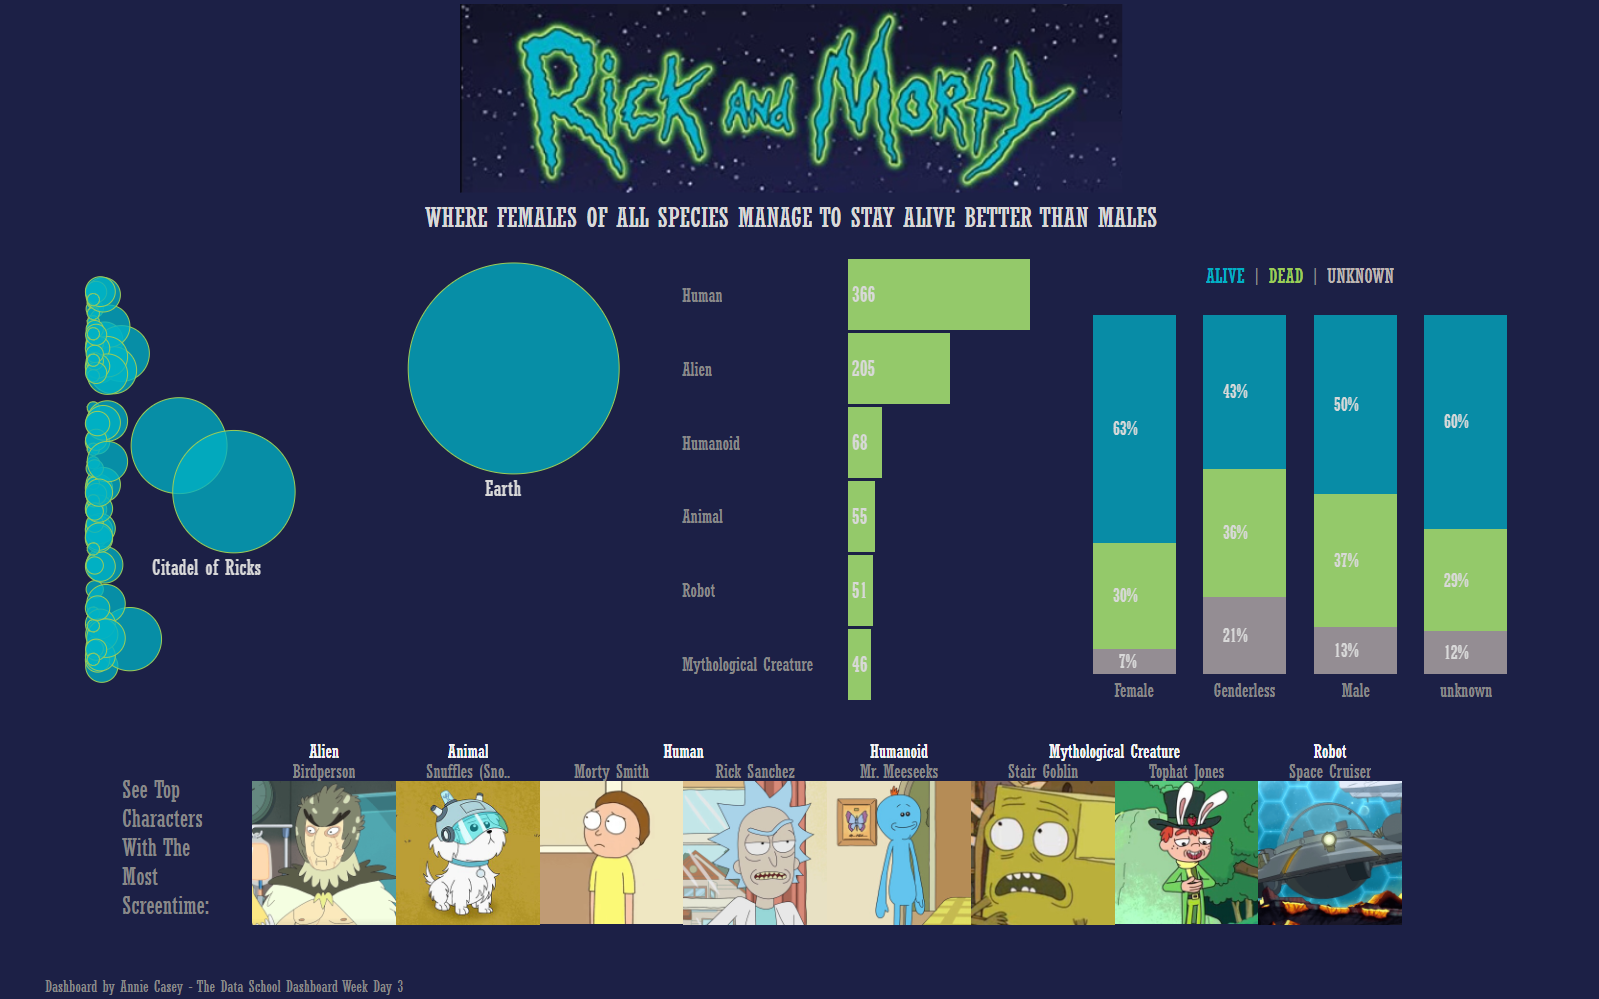
With the API data, I created a dashboard highlighting where characters were located, showed the magnitude of each species, as well as highlighting the trend of the proportion of females staying alive being larger than the proportion of males staying alive consistently across species. A fun part of building this dashboard was using the image URL provided in the API to change the "image role" in tableau to have the images of each character appear as a dimension. I used this to visual show at the bottom which characters appeared in the most episodes for each species.