On Day 4 of dashboard week, we were assigned candy survey data to prep and build using Tableau Prep and Tableau in the browser. This is to simulate a placement with a client where their license is limited to online/browser only and would not have desktop available.
The survey and data can be found here: https://www.scq.ubc.ca/so-much-candy-data-seriously/
We had to download all four years of survey data and quickly learned that none of the four years were formatted the same or had the same column headers so it took having to clean each file individually before unioning them all together. Although the files were pretty different, the cleaning steps were similar:
1. find which columns were the candy questions and clean them (ie remove "Q6 |" or remove surrounding parenthesis "()")
2. Remove any unnecessary columns. This was typically any miscellaneous questions that did not align across years
3. pivot the candy columns to rows. This will result in having a "Candy Question" column and a "Candy Feeling" column.
4. Do those steps for each year and then make sure the columns are all named the same across years
5. Finally, union them all together so they are one table with all years
Unsurprisingly, we ran into some issues and the above steps didn't get completed for all four years of data. The 2014 data set was already aggregated while the other three years were disaggregated whereas a row represented a single respondent. Because of this, I decided to omit 2014 from the final data set.
In the below screenshot you can see that the other three years were cleaned and unioned together easily. The final issue we ran into was the output of the union of the 3 years. The union appeared to work with no issue (ie no Alerts) but as soon as I tried to attach an output step, it flagged an alert saying there was an issue with the data source. After a lot of troubleshooting, we found that the 2017 file was the problem (the blue steps in the below image) and so for the sake of time, I chose to remove the 2017 data (deleting the four blue steps) and then the output step would execute with no problems.
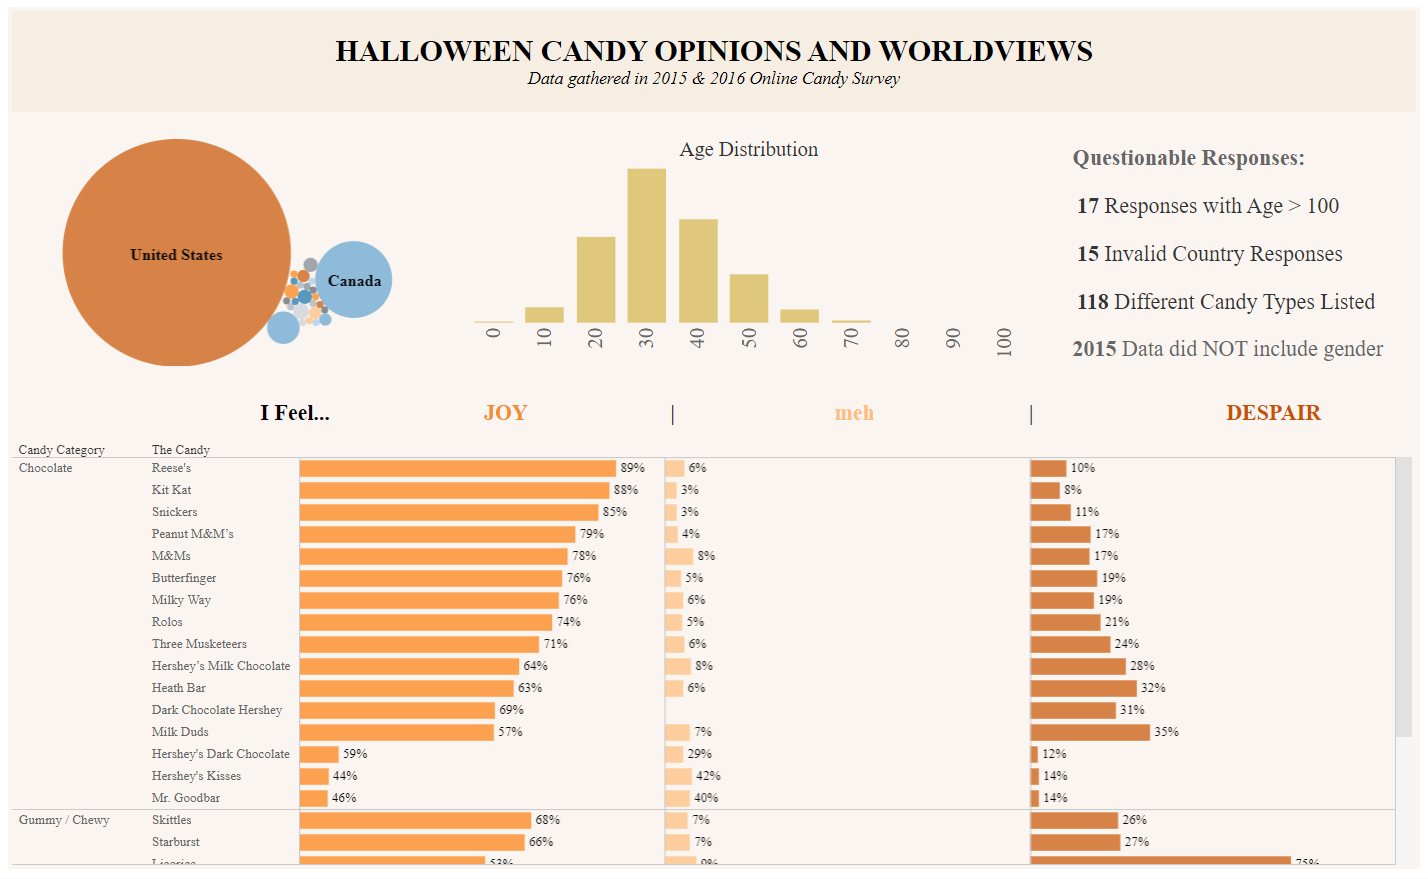
After the data cleaning, I started to build in Tableau in browser. I wanted to include some attributes of the respondents such as location and age. I would have liked to include a few more attributes such as the responses to the questions "are you going trick or treating this year?" and "do you see a blue/black dress or a white/gold dress?" to provide a bit more context to who is responding to this survey.
Other than the respondent attributes, I picked out the candies that I thought were the most common on Halloween and categorized them into Chocolates, Gummies and Hard Candy. Them the main part of my viz was to show what the feelings were towards the specified Halloween candies (joy, meh or despair). I decided to use table calcs as labels for this bar chart to show what the percent of total responses for a given candy were.
I would have liked to include a bit more under the "Questionable Responses" section, highlighting any strange/funny responses that were recorded and going more in depth on what was excluded from this dataset and why.
https://public.tableau.com/app/profile/annie.casey/viz/HalloweenCandySurvey/Dashboard1?publish=yes