


On the second day of dashboard week DS44 were given a Lego themed dataset and tasked with creating a report in PowerBI. It involved preparing and retrieving tables from snowflake using SQL and focusing on a specific topic to narrow our scope for the day.
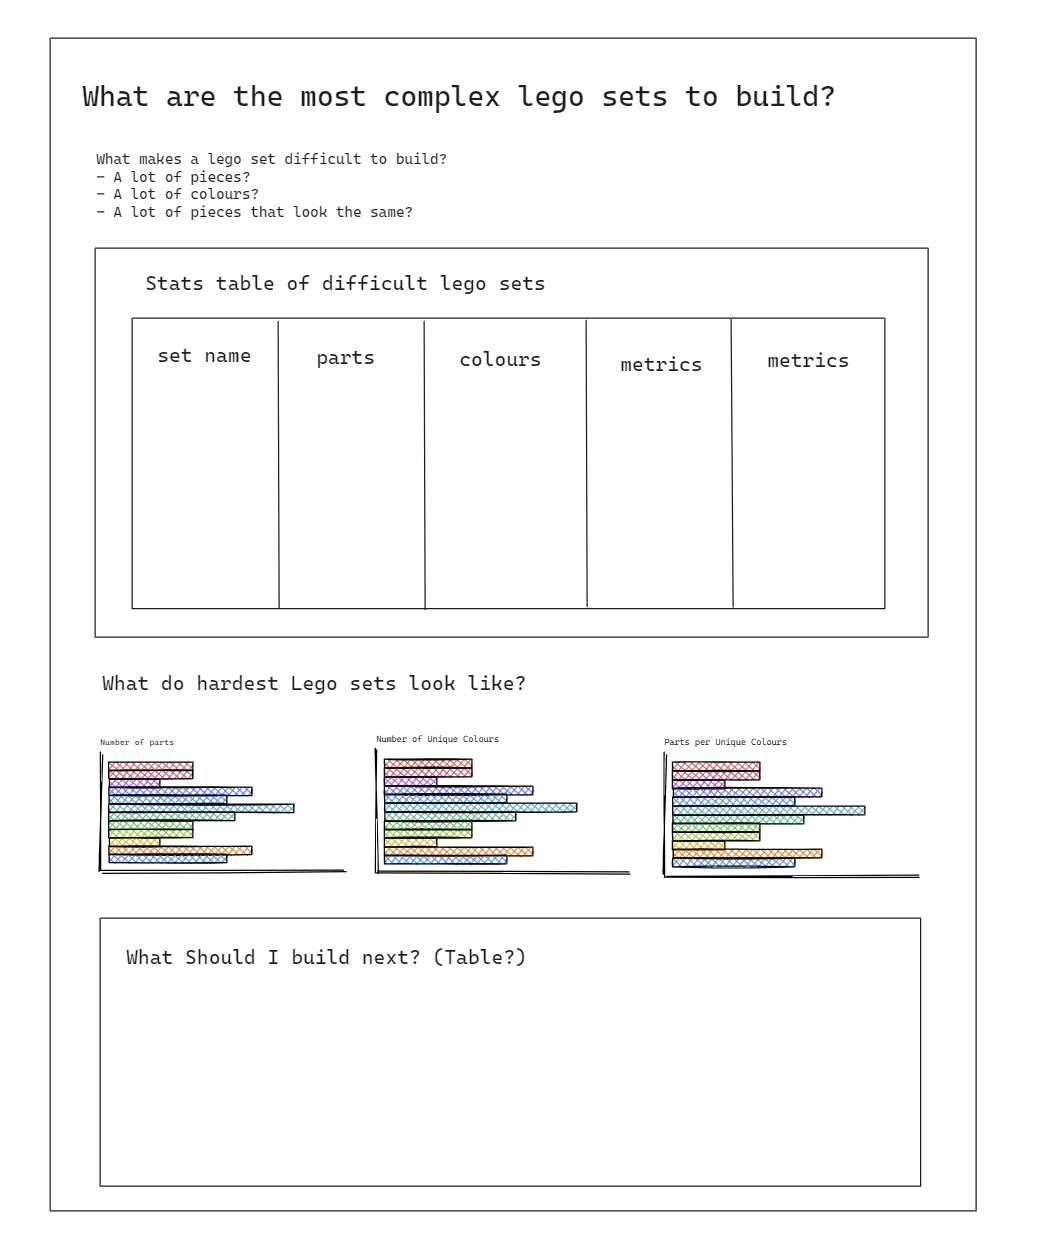
I started off with having a quick look at the tables using SQL to see what information the datasets had about Legos in order to find a topic. I saw that there were tables including information about different Lego sets, the parts that are in these sets, and the colours of the different parts as well. Knowing this I started to sketch a rough plan (pictured below) for my report what I wanted to answer the question: 'What is the most complex Lego set to Build?'
After this point I knew what columns and tables I needed from the Lego dataset so I used the SQL query below to extract the tables:
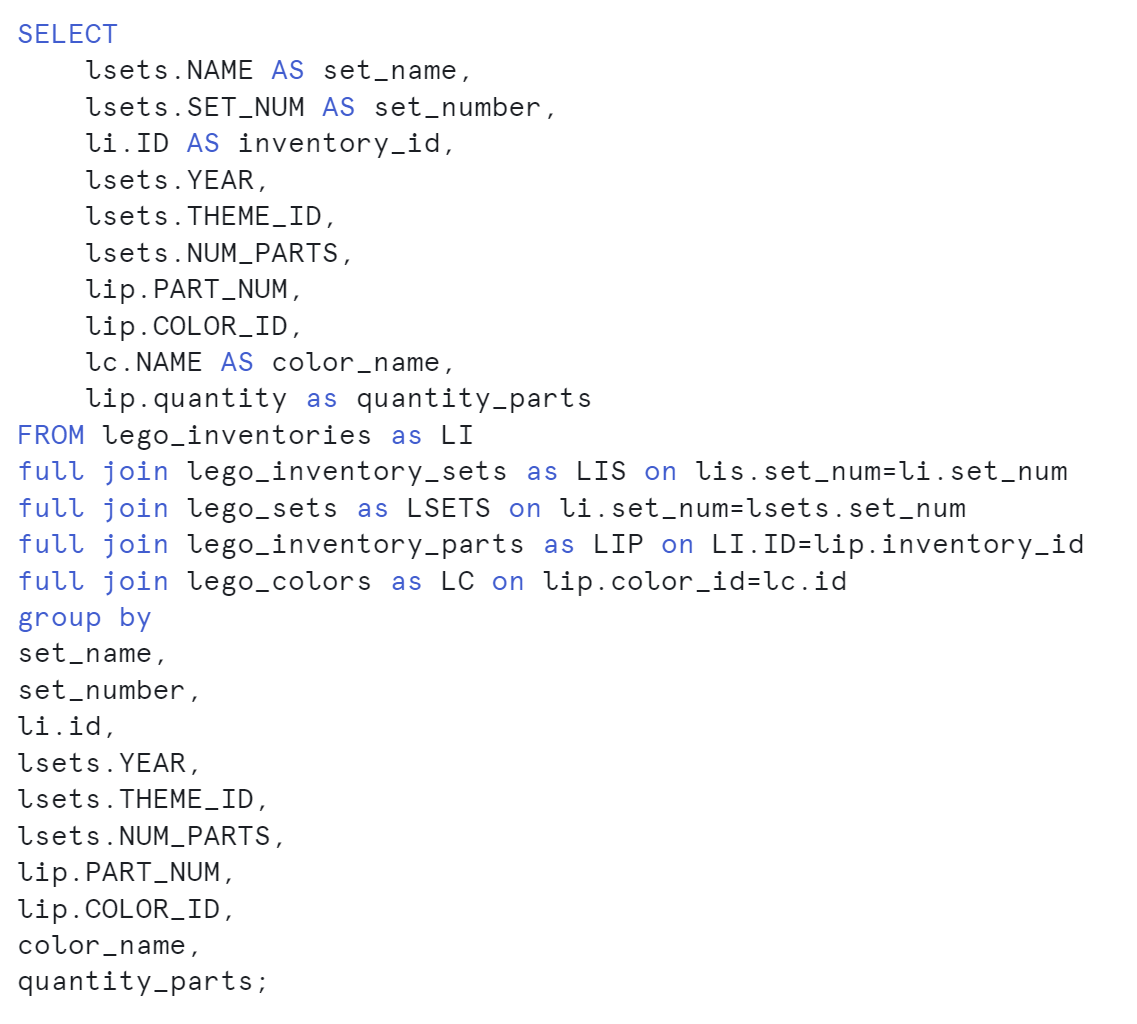
I encountered an issue where there were duplicates of several rows which resulted in figures that were higher than usual, so I grouped by all of the selected columns to remove the duplicate rows.
I then started to build the report in PowerBI which was simple since I had planned for quite a simple report. The table at the bottom of the report is filtered to sets that meet the above average figures for each measure.
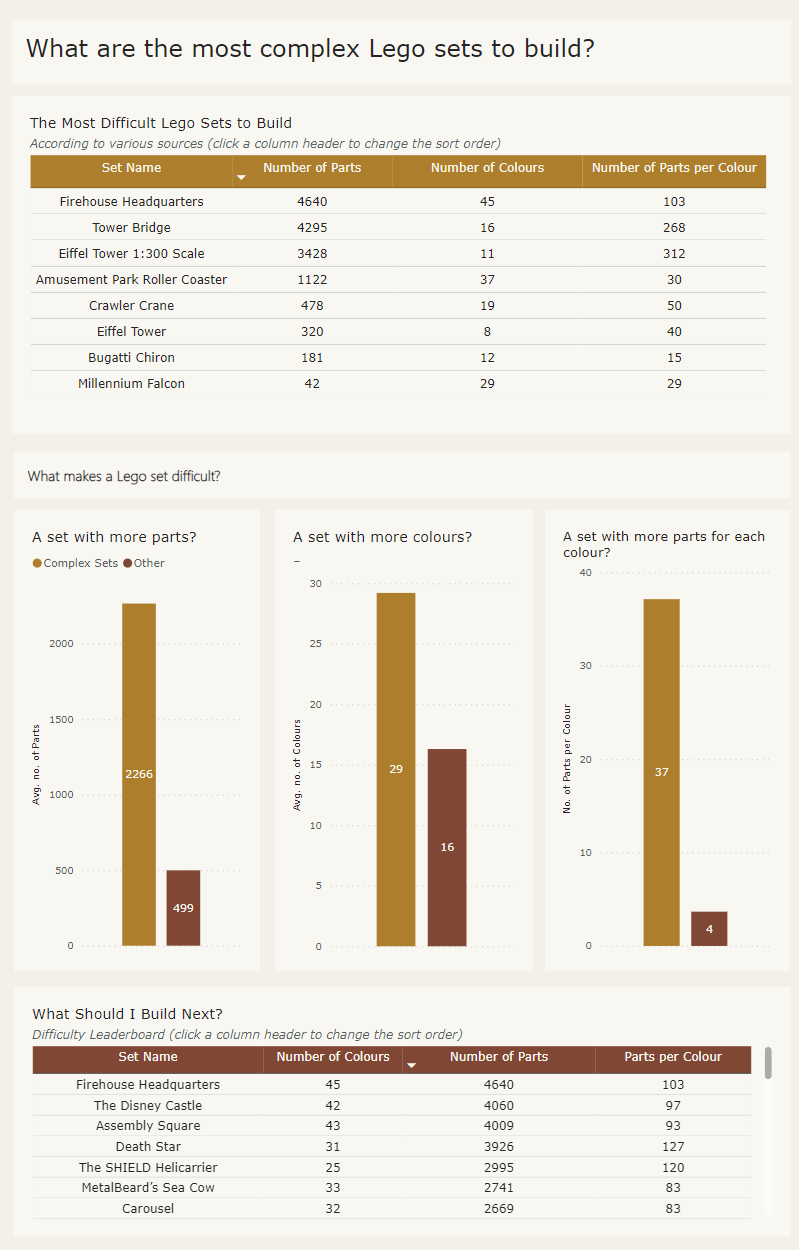
If I were to recreate this with more time I would change the bar charts into box plots and filter the leader table to look at sets within the interquartile range of each measure, or filter to look at sets that fall within a certain standard deviation of the average of each measure.