


The Ideal Data Structure for Analytics
BI tools can connect directly to dozens of data sources for example:
- Flat files: CSVs, Excel spreadsheets, JSON files
- Cloud storage: Google Drive, Microsoft OneDrive, SharePoint
- Data warehouses: Snowflake, Google BigQuery, Databricks, Amazon Redshift
While connecting directly to flat files or cloud drives works for small, static projects, large scale analytics tends to rely on cloud data warehouses.
To deliver fast, reliable insights, data must first be modelled for analytics in a suitable structure. Like in a star schema or in wide denormalised tables, for instance.
Raw data coming from production databases or third-party APIs rarely looks like this. It is often messy, deeply nested, poorly named, and scattered across dozens of relational tables. Transforming that raw data into structured analytics models is the core domain of data and analytics engineers.
How Data is Transformed and Made Available to BI Tools
If you work as a data analyst, you may use SQL regularly to read data (SELECT statements). However, making transformed models permanently available in a warehouse for BI tools to connect to requires SQL that writes data:
- DDL (Data Definition Language): Statements like CREATE TABLE, DROP TABLE, or ALTER TABLE that define the database structure.
- DML (Data Manipulation Language): Statements like INSERT INTO, UPDATE, or DELETE that modify the actual rows.
Writing DDL and DML manually is tedious and error-prone. You have to handle table creation, manage update frequencies, write complex boilerplates, and build custom scheduling scripts to ensure tables refresh in the right order.
Where dbt Comes in
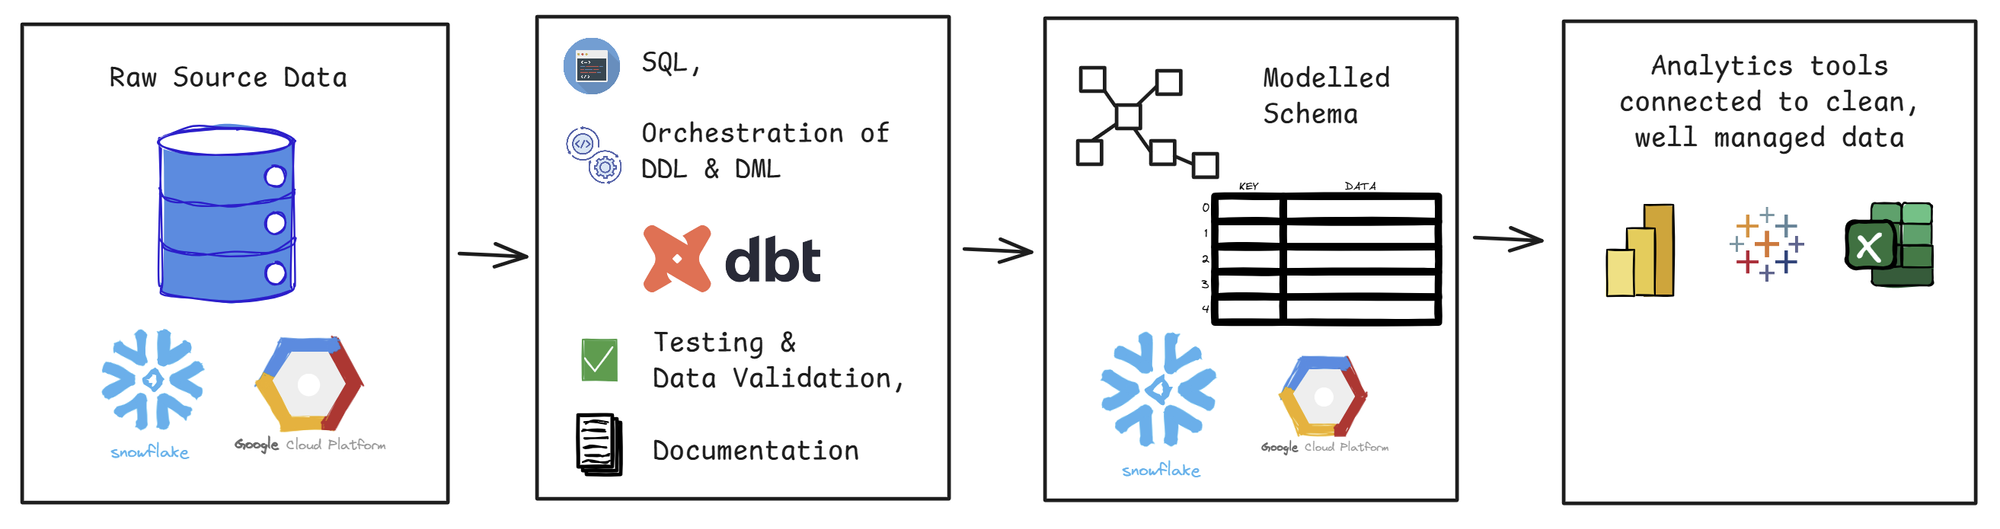
dbt (data build tool) sits directly on top of your data warehouse and eliminates the need to manually write DDL or DML.
With dbt you write standard SELECT statements to define your business logic and transformations. Then dbt handles the orchestration. It wraps your SELECT queries in the necessary DDL and DML (such as CREATE TABLE AS SELECT or incremental INSERT logic) and executes them directly inside warehouses like Snowflake or BigQuery.
Improved Way of Working for Developers
Before tools like dbt, developers often built tables independently, leading to duplicate metric definitions and unmonitored changes.
dbt brings software engineering best practices to data teams:
- Version Control (Git): Every change is tracked, reviewed, and tested before it is available in a warehouse production environment.
- Collaboration & Governance: Multiple developers can work on the same codebase without stepping on each other's toes or overwriting warehouse schemas accidentally.
- Automated Testing & Lineage: Data quality checks can be run before data reaches end users, and built-in visual lineage graph shows exactly how source data flows into final tables.
How dbt Improves Analytics
Once dbt compiles and writes these transformed, tested models into a production environment within your data warehouse, BI tools can connect directly to the curated output tables.
For analysts this means, faster performance as complex joins and aggregations are pre-computed by dbt, so BI tools don't have to process them on the fly; a defined single source of truth as business logic is defined once in dbt, ensuring that all reporting shows consistent numbers; and cleaner data models as analysts can drag and drop clean, well-named fields without needing to write custom SQL queries or complex calculated fields themselves.