


Tableau explains parameter as a workbook variable such as a number, date, or string that can replace a constant value in a calculation, filter, or reference line. And I would like to show you a practical use of a parameter.
I will walk you through an exercise about creating interactive Bar Charts that change depending on the Segment you decide to select. For this exercise I will use a Sample Superstore dataset.
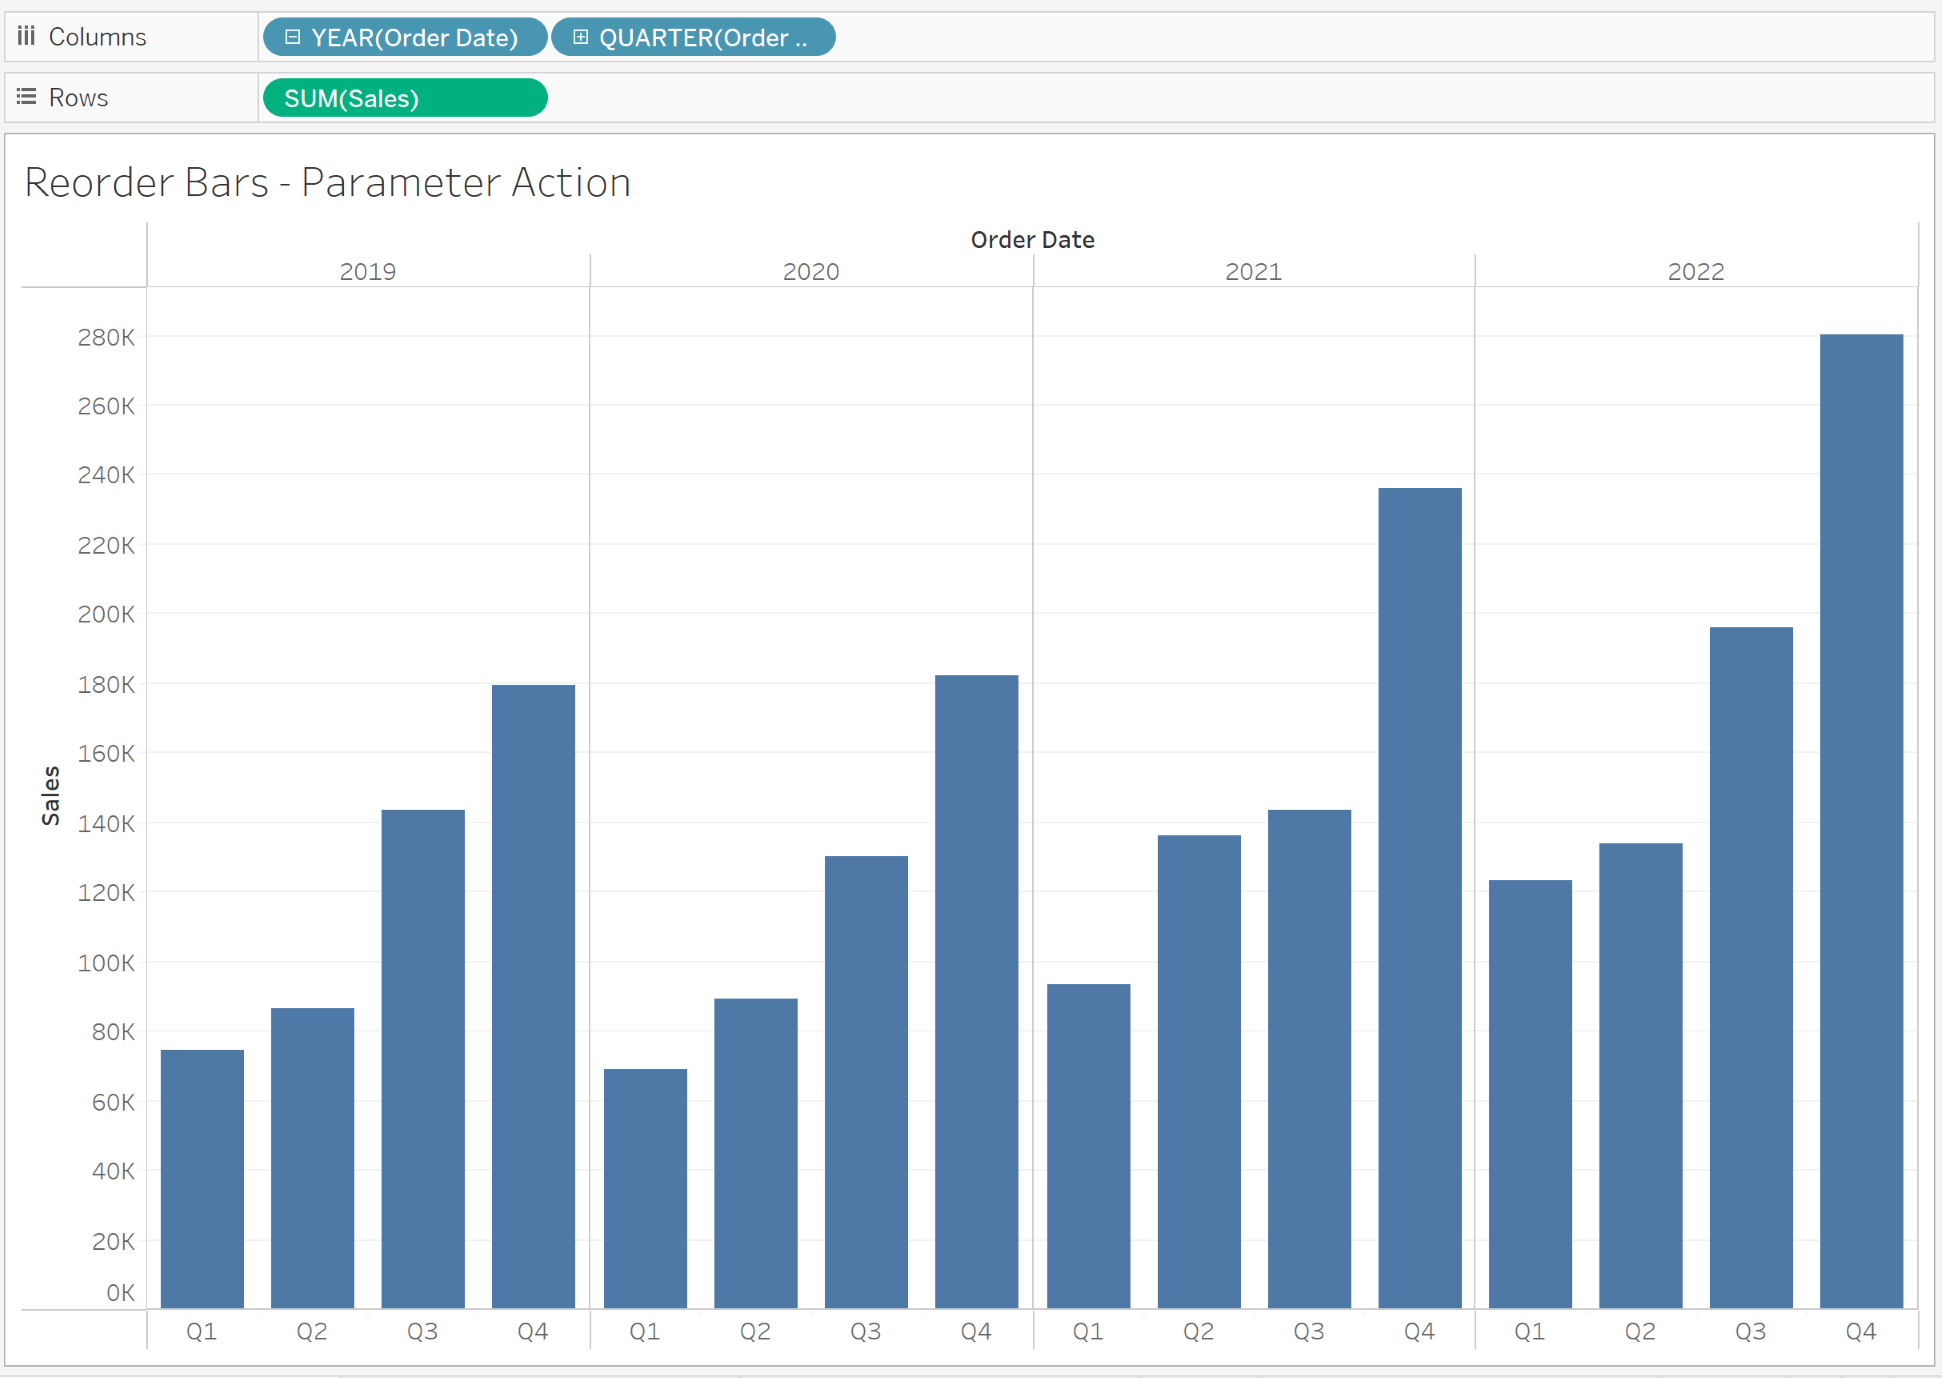
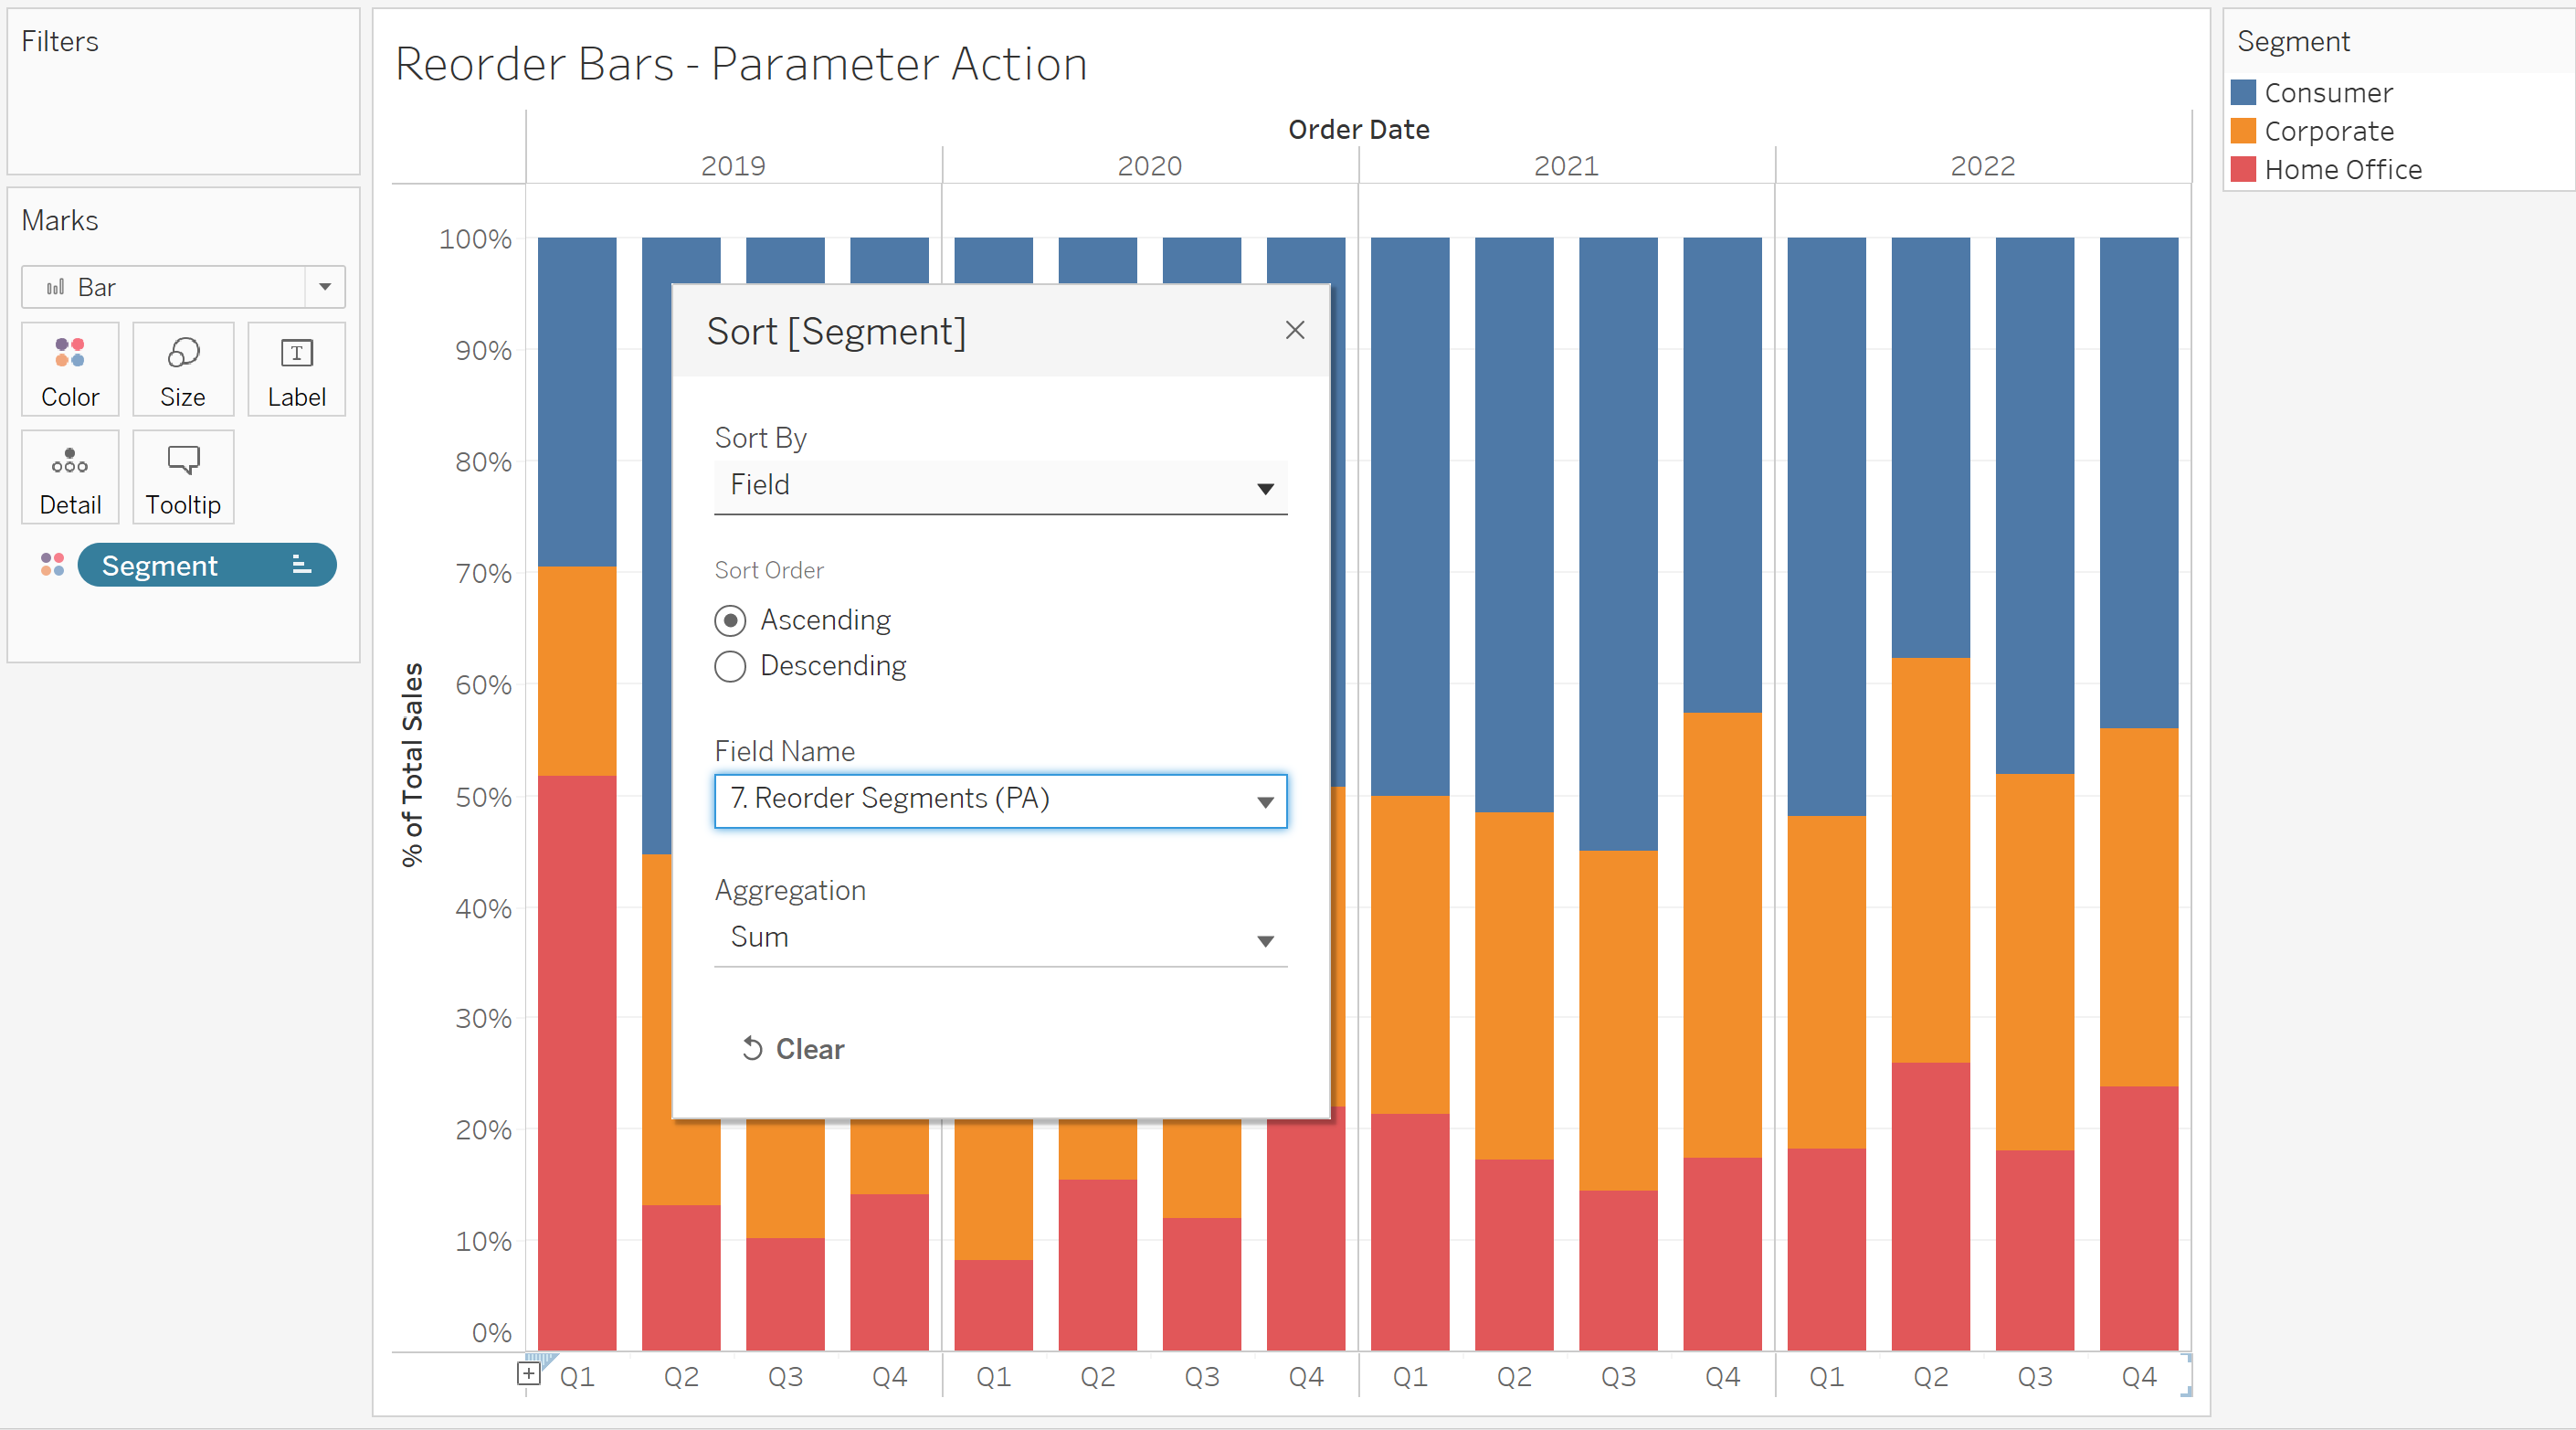
Because we would like to see the sales of different segments depending on quarter of the year, we need to drag Order Date by Year and Quarter into Column Pane, and into Rows Pane Sales that will automatically aggregate into Sum. Our view should look like the one below.
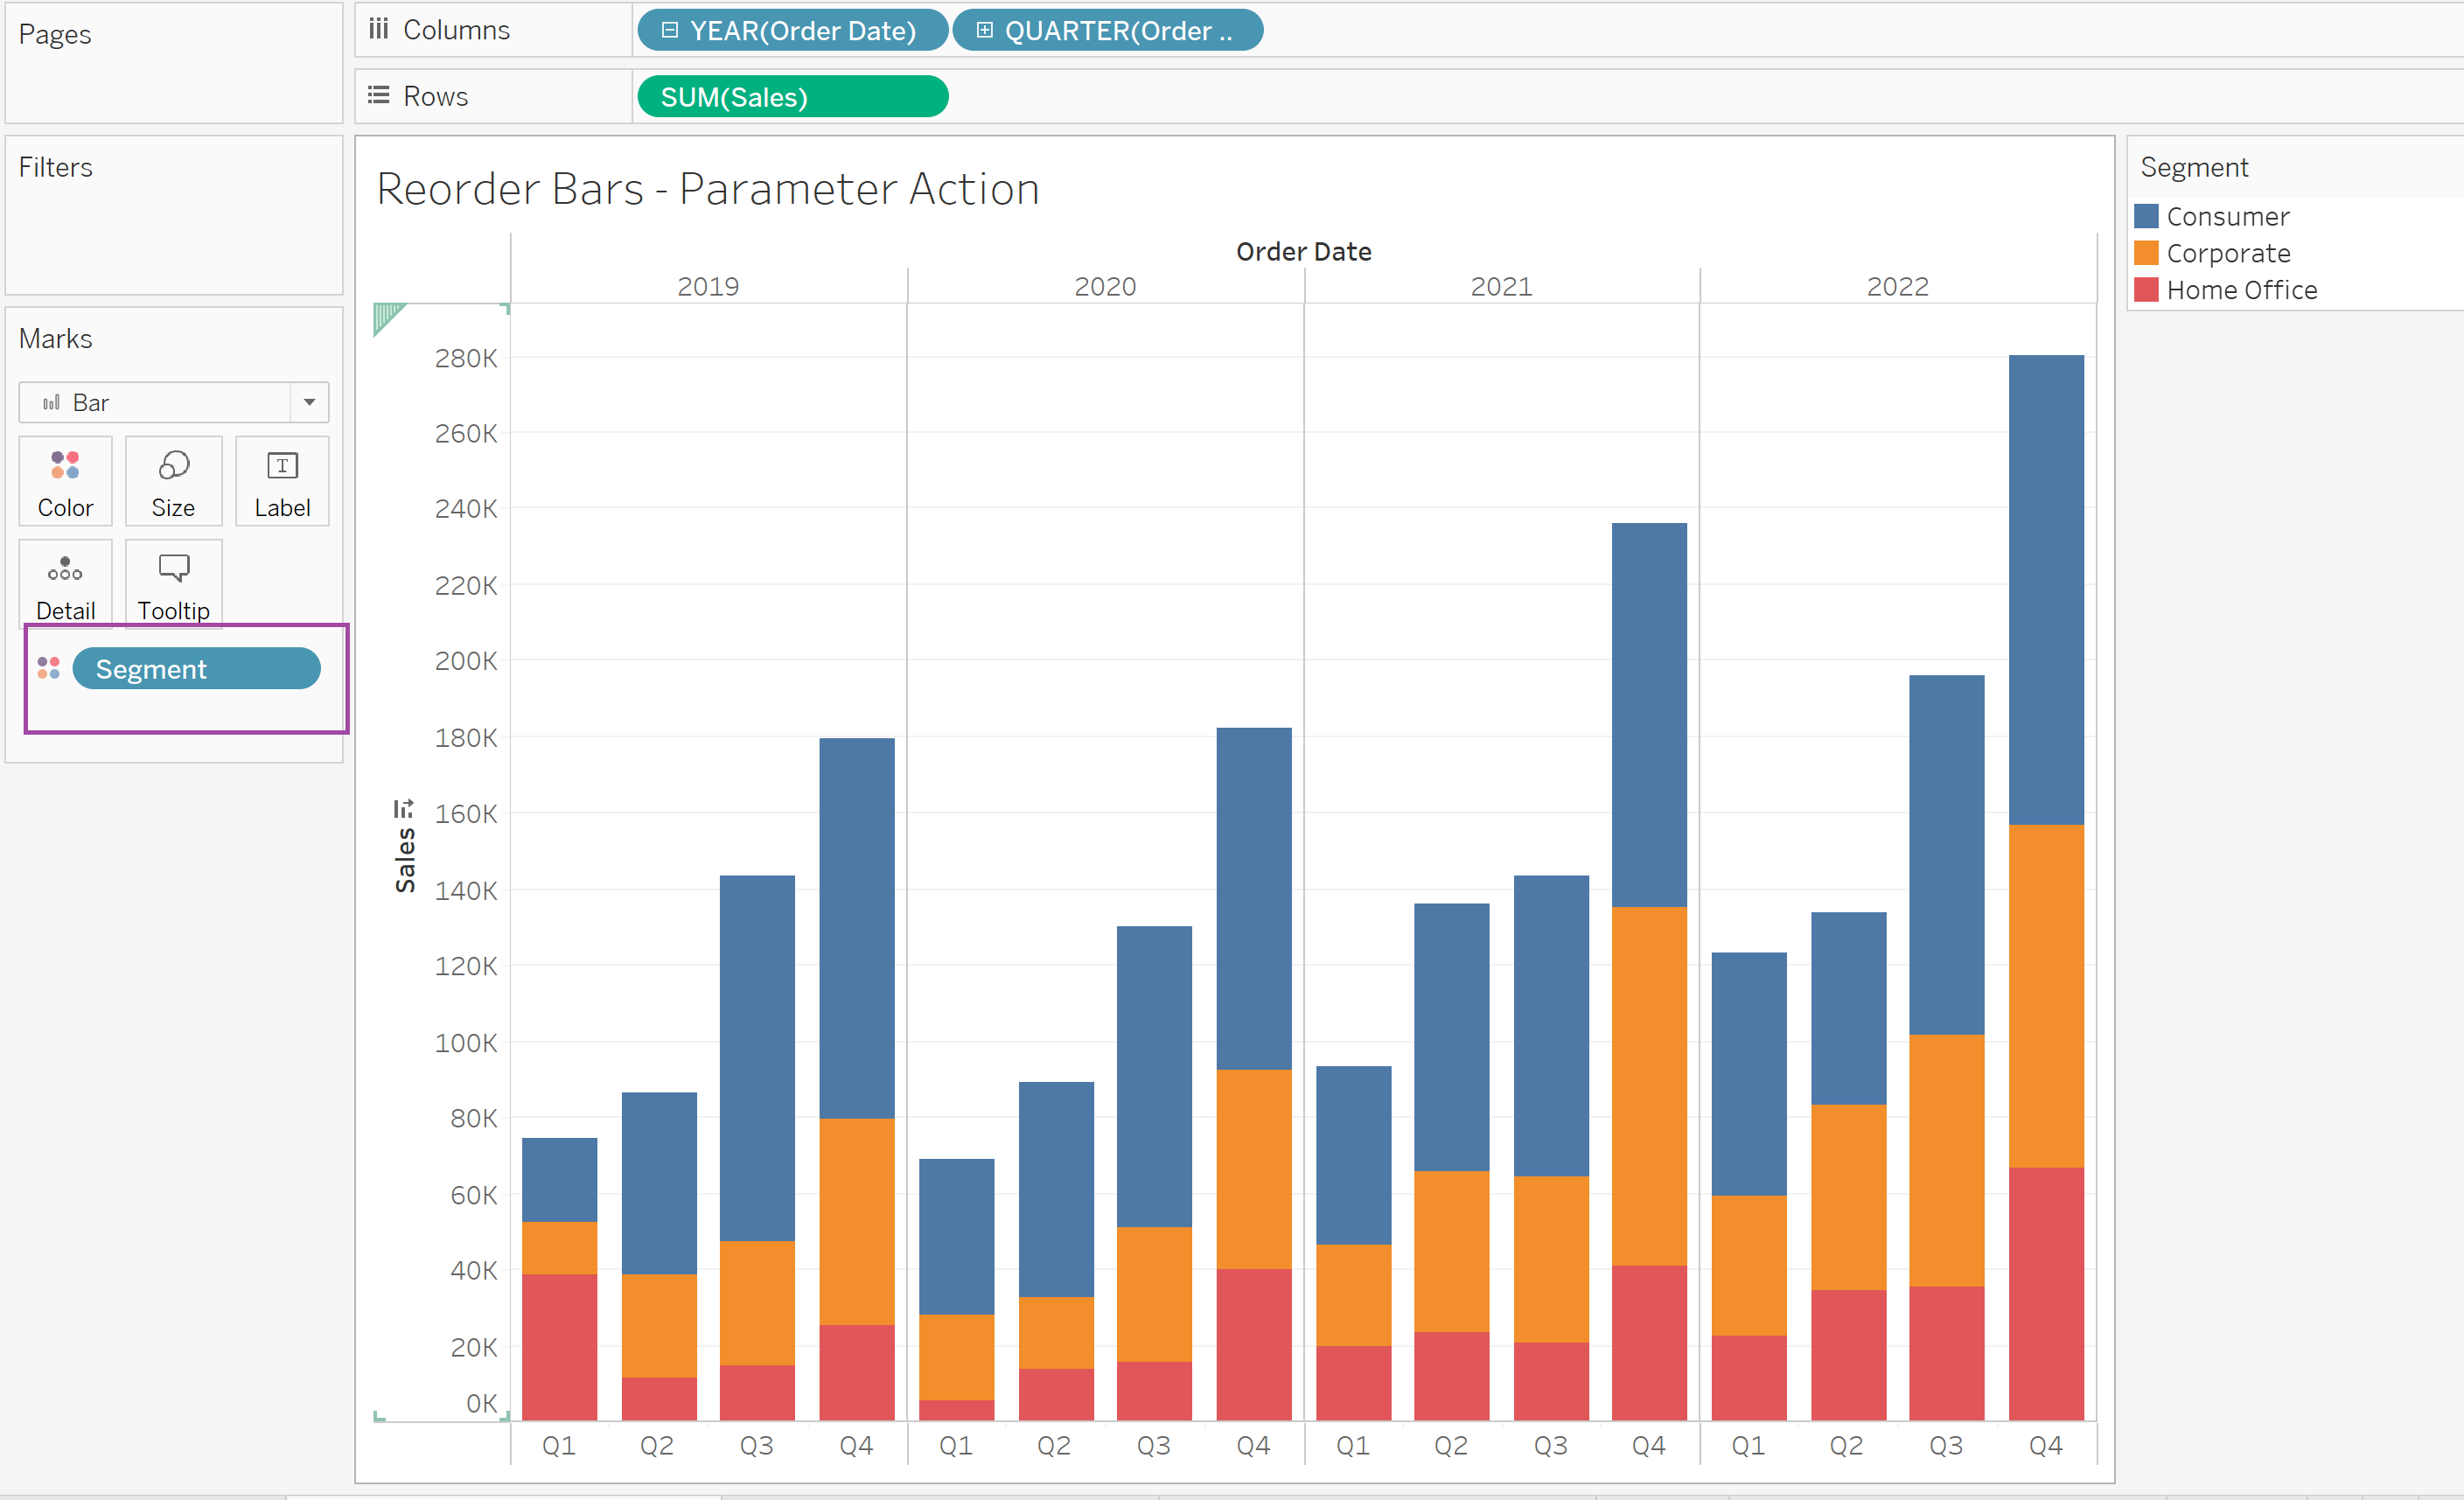
We want to see how different segments participate in our quarterly sales. To see it on the bars, we need to drag Segment from the Data Pane into Color Marks Pane.
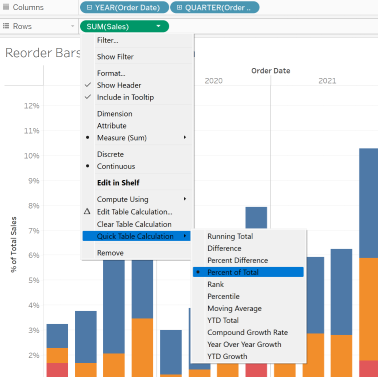
Next, we would like to know the percentages of particular Segments within Quarters of each year. To do that, we need to right select the SUM(Sales) field and select Quick Table Calculation and select Percent of Total.
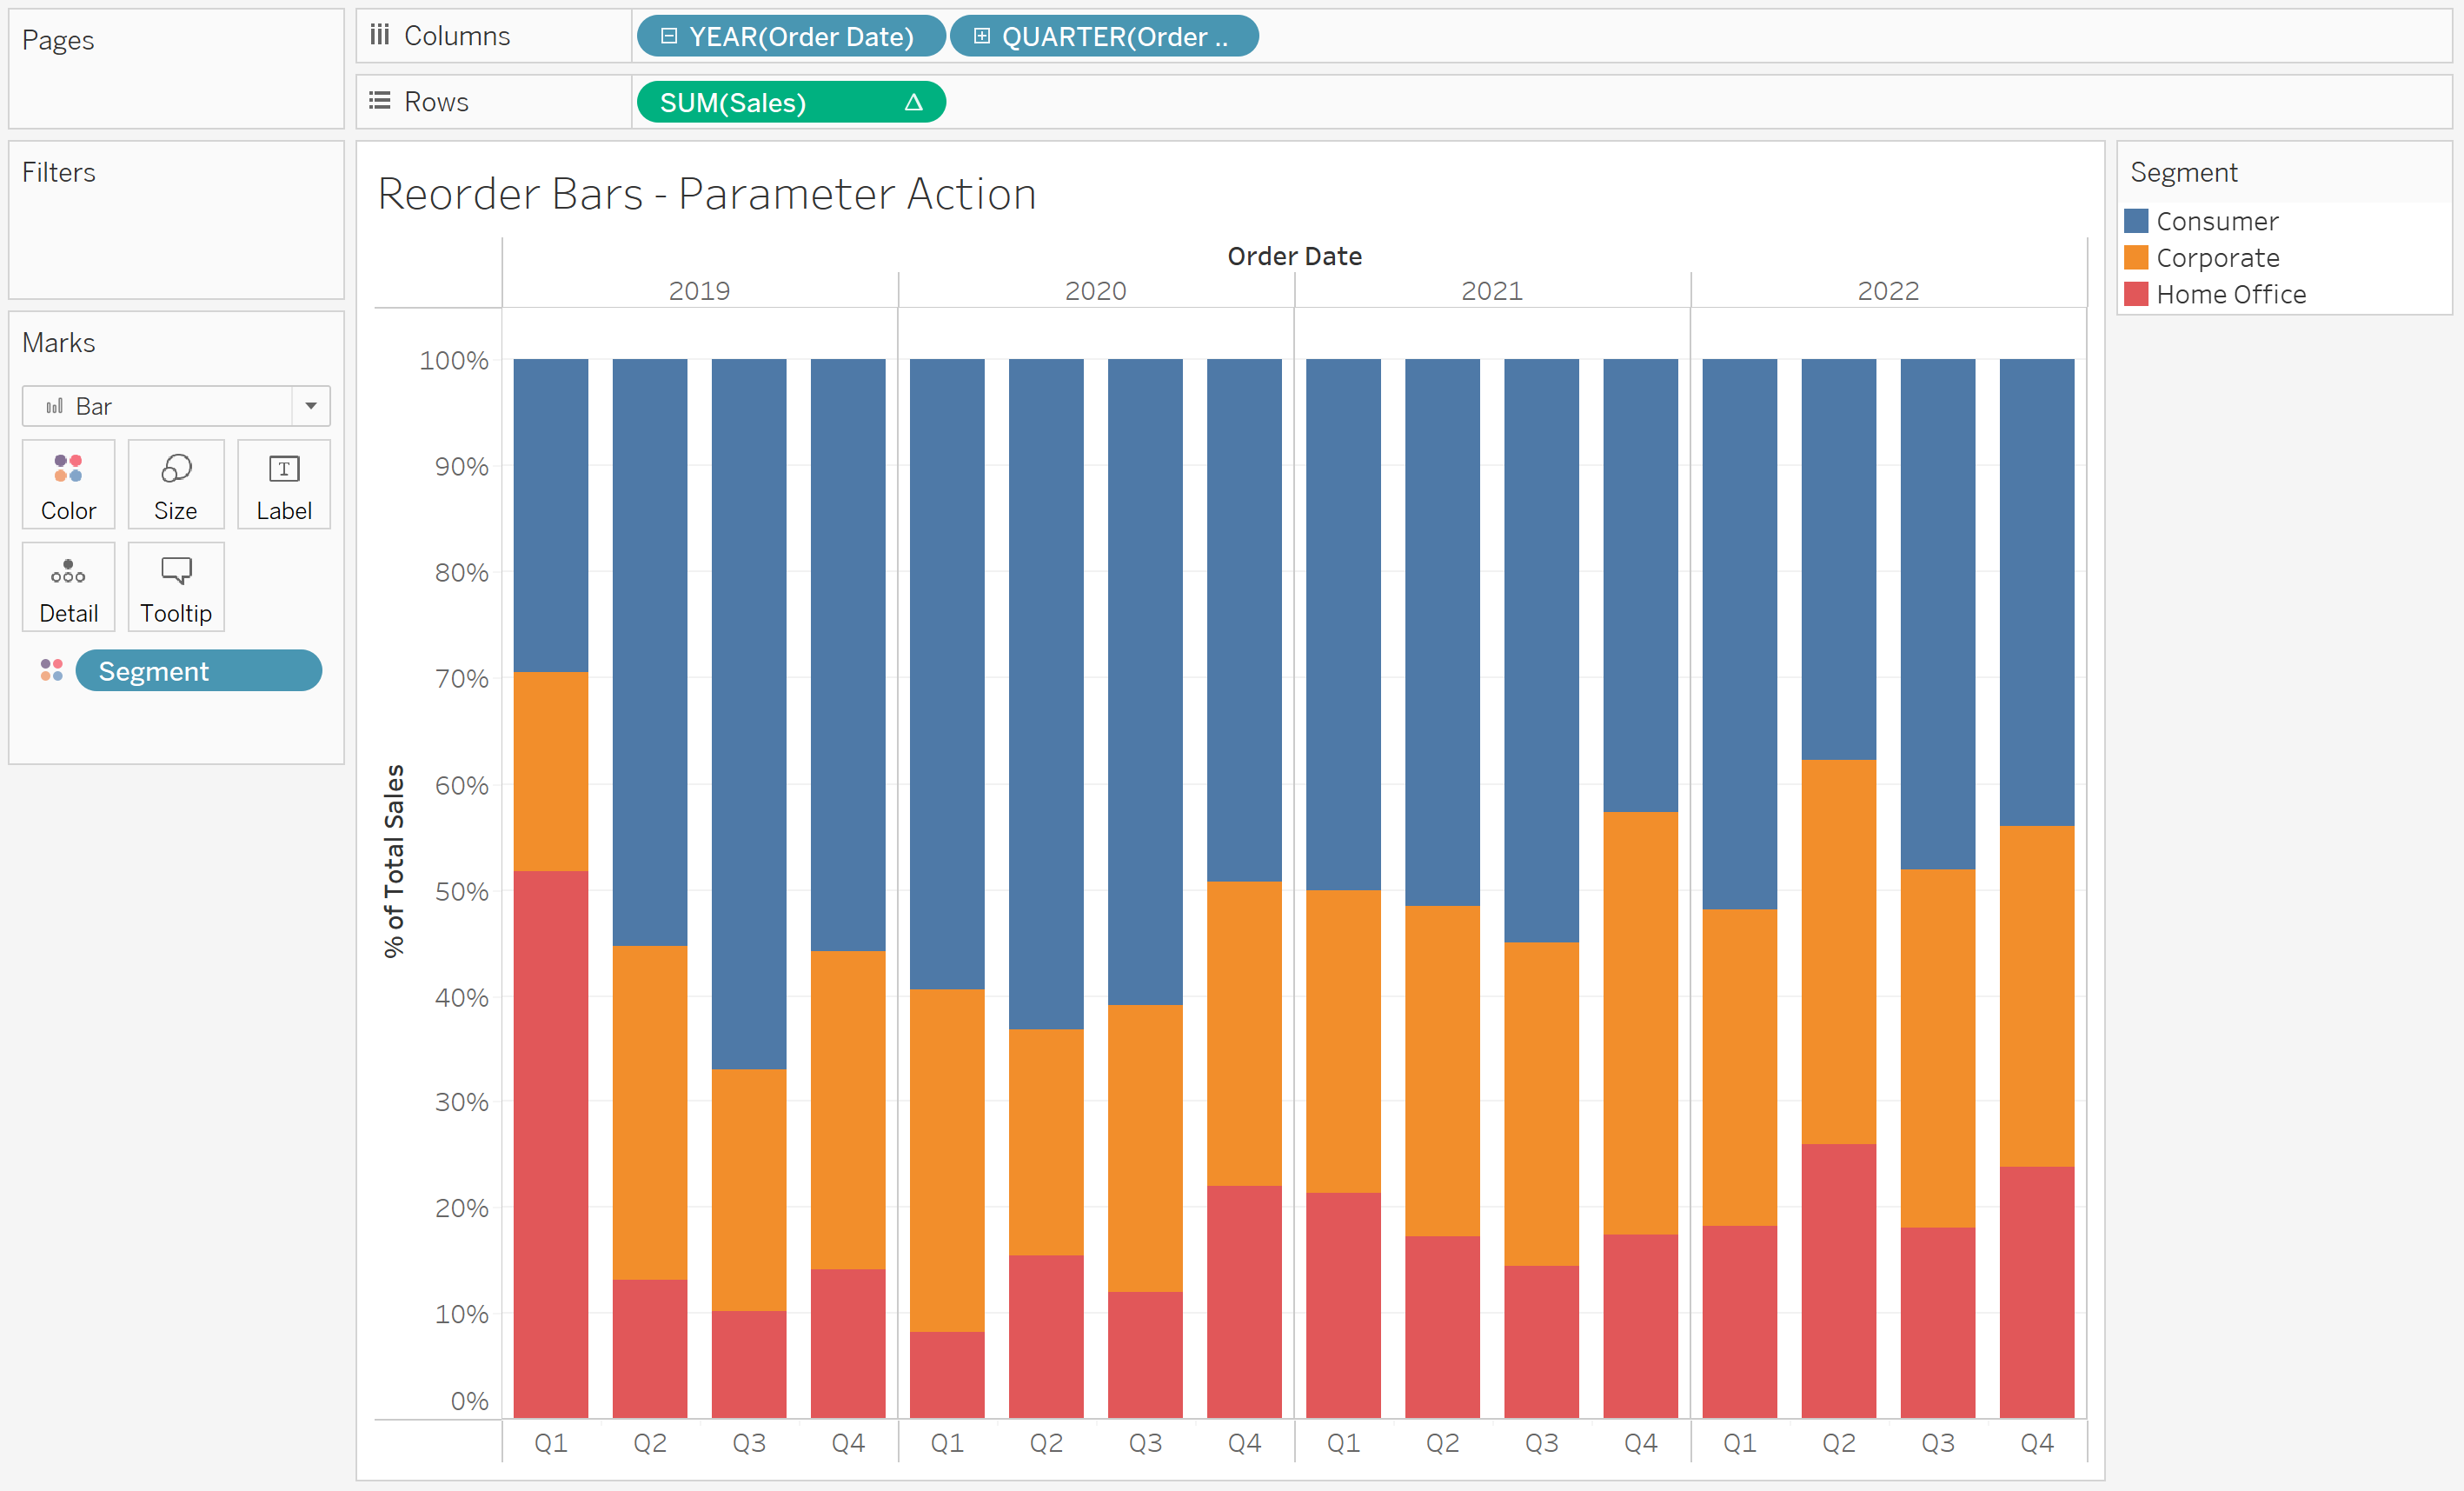
Because we would like each of the quarters to make up to 100% of the Segments, we need to Edit the Table Calculation.

We need to set our Compute Using by Cell and make sure that in the Specific Dimensions field the Segment is selected. At this stage our worksheet should look as follows.
Depending on the highlighted Segment, we would like our Bars to reorder their content. We can do that thanks to a parameter. Let's create one. We need to click the triangle, next to the Search Pane, and select Create Parameter.

I named mine Segment Parameter with the Data type - String like my Segment data type, and I set the Current value to Home Office. To make our Segment Parameter do something, we need to create a Calculated Field that would let us change its position.

My Calculated Field is an IF Statement where if my Segment Parameter is selected then it selects Sales of this particular Segment, otherwise the value is set to 0.
The next step is to use the above Calculated Field to sort the segments, we need to right click the Segment field in the Marks Pane and select Sort. We would like our Segment to be sorted by the Field and the Field Name is the previously created Calculated Field.
The next step is to select Worksheet and then Actions and Add Action - Change Parameter.
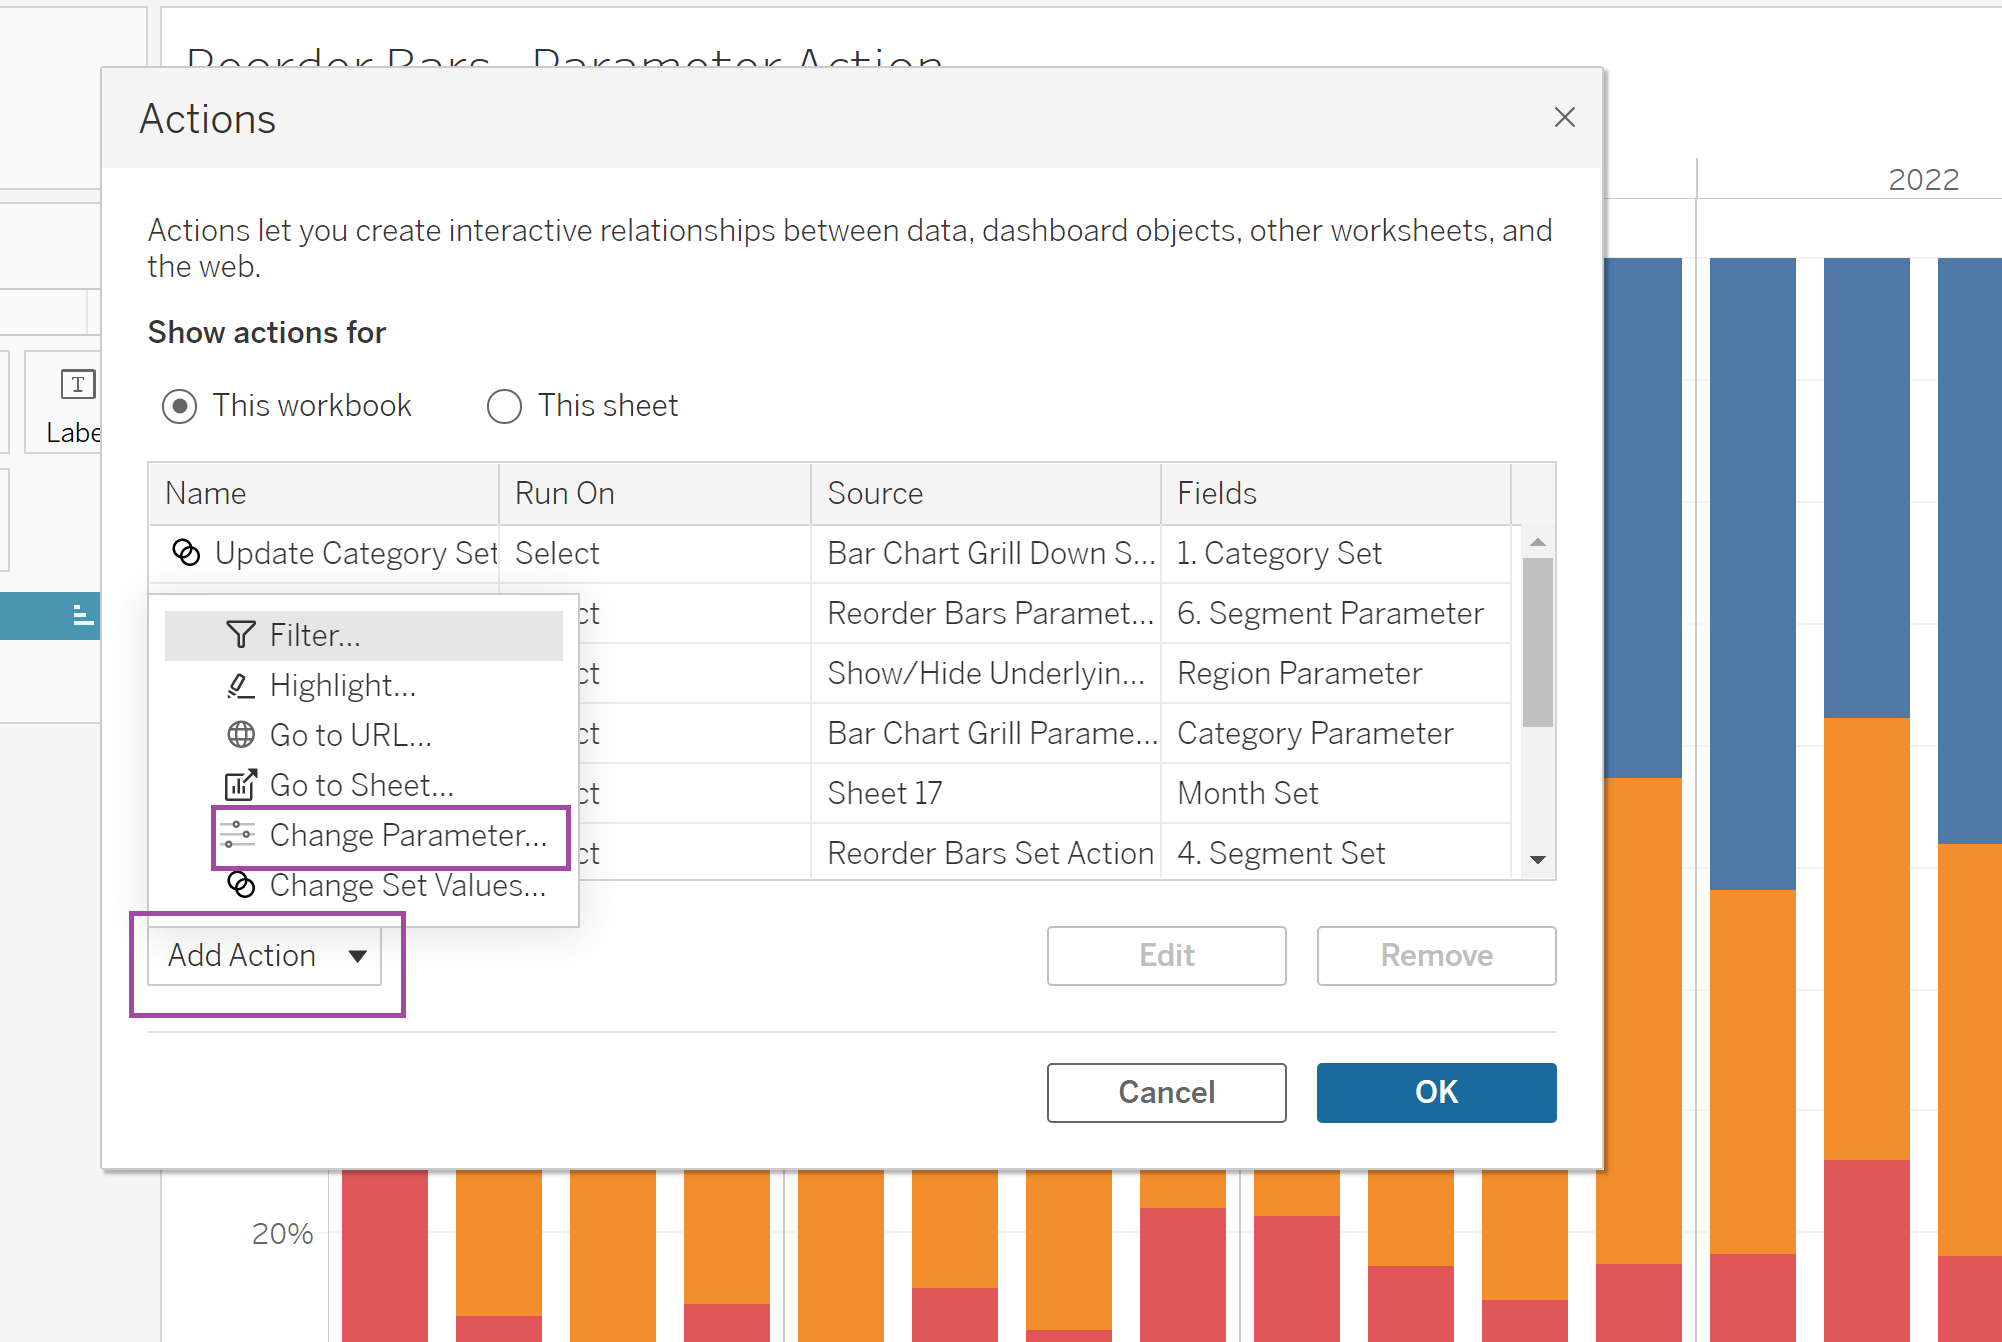
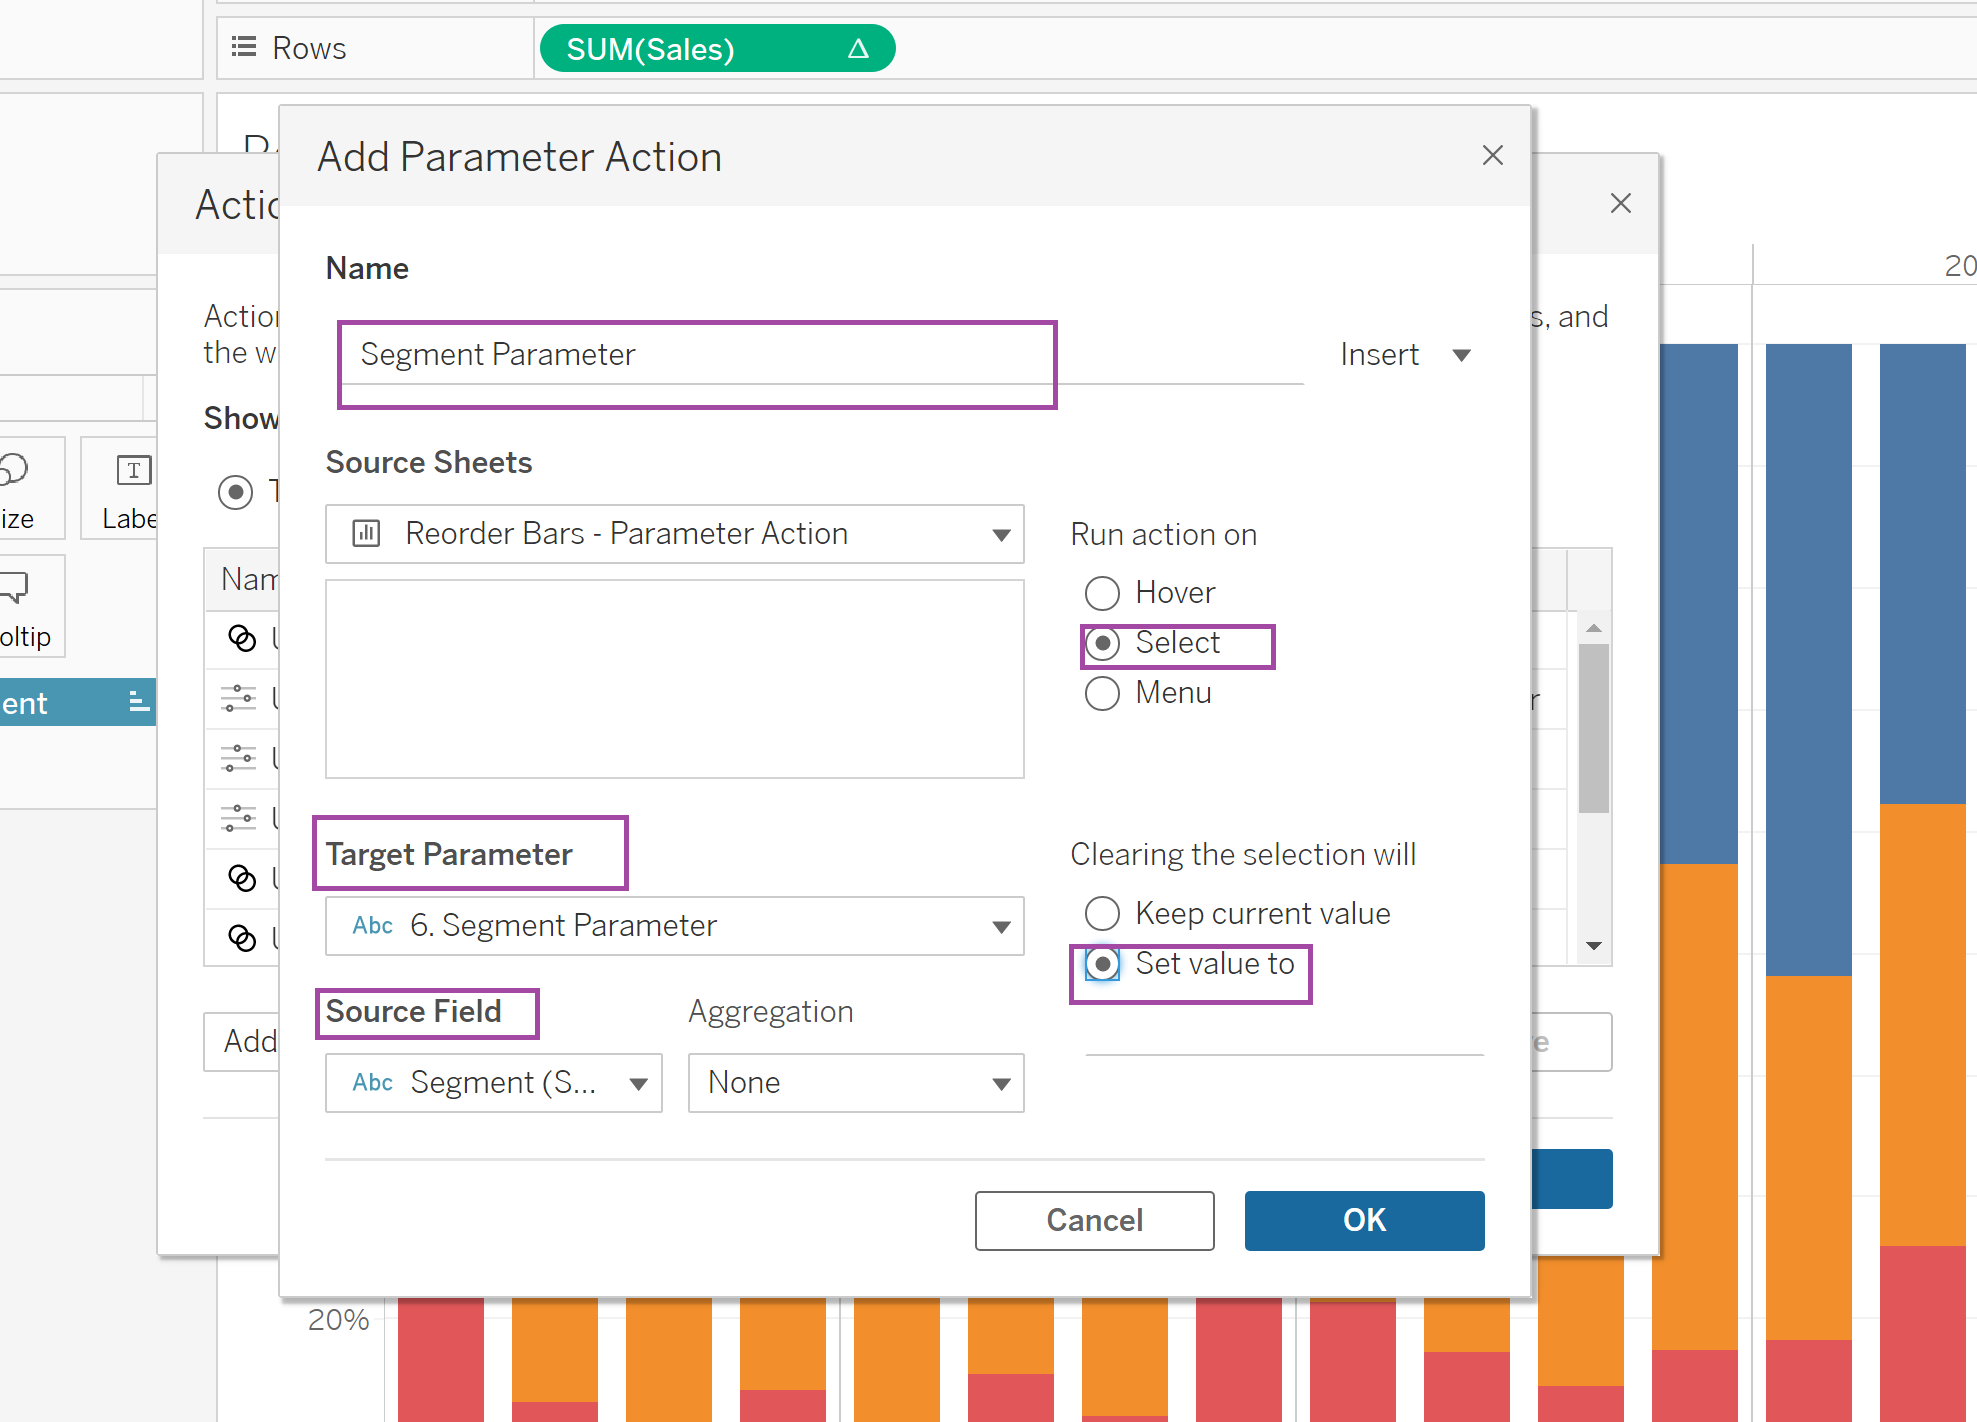
In the Add Parameter Action Window, the Target Parameter is the parameter that we created previously, the Source Field is the Segment data that we would like our parameter to target.
At this point our Bar Charts should change depending on the selected Segment.