


Today, our cohort was tasked with dataset coming from Cat Tracker Website. We were given freedom in regards to of type of dashboard we wanted to design, as well as the scope.
After the initial data discovery, I decided to create a dashboard analysing cats as predators, focusing mainly on impact of age and sex. I sketched briefly a template highlighting questions that I wanted to answer.
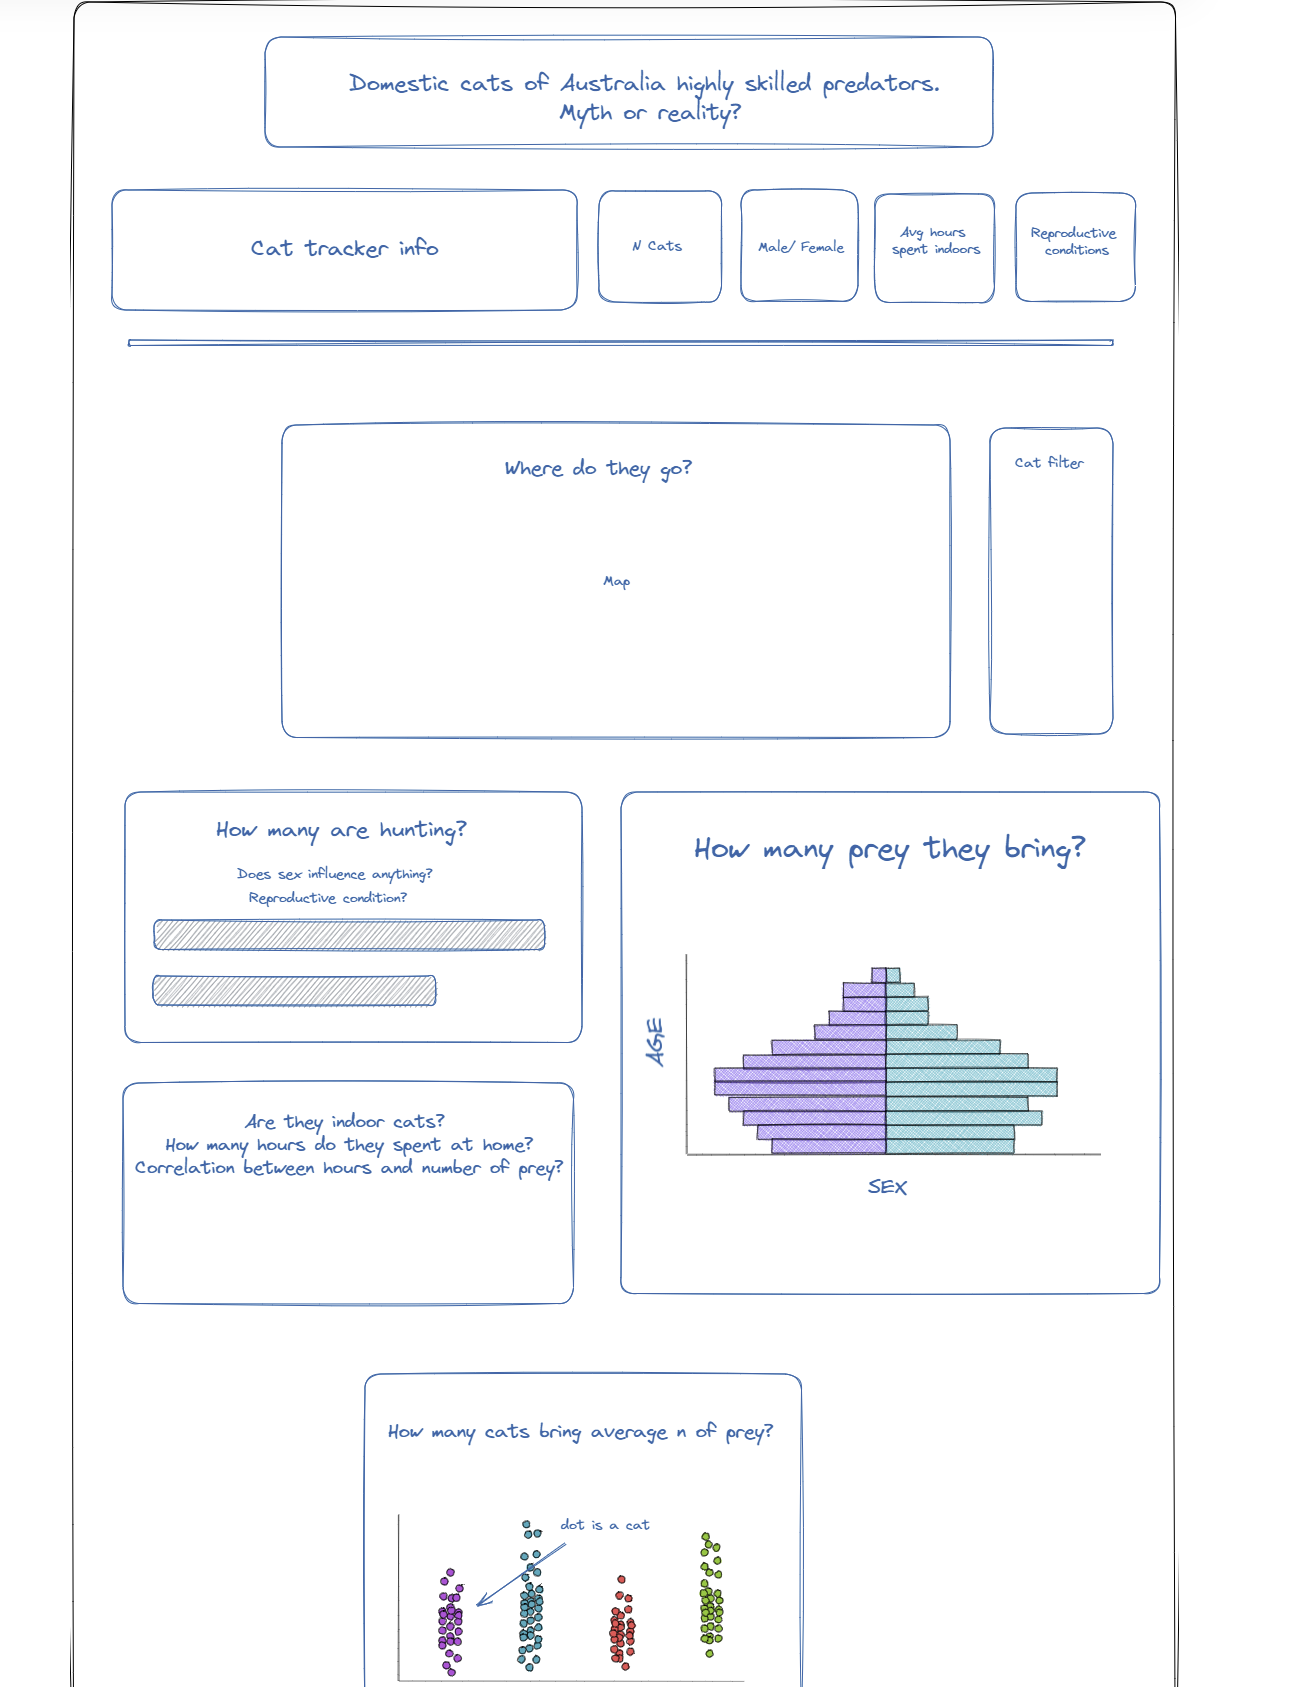
Funny enough, I had to completely change the initial approach after probably an hour. Why? To make some of the charts I would have to reshape the data and I was scared to task myself with that today. Instead, I decided to focus on questions that I wanted to answer and the initial sketch came very handy. I think I played it simple but given the time, I didn't want to over scope.
Overall, I enjoyed todays task. I think that the dataset was interesting and fun.