


Today's task: Basketball Statistics and webscraping with PowerBI. The requirement for today was to initially bring 20 URLs from Basketball Reference Website.
The idea seemed simple, in PowerBI you add website as your Data Source and choose tables you want to import. However, importing multiple tables from multiple websites starts being a bit overwhelming, when you want to import data for 20 years. Thankfully, we narrowed down our scope and we could focus only on 5 years. The task became easier, however still took me longer than I expected.
Few issues that I encountered throughout the process:
- PowerBI tends to update the column names, in the end they were not matching the rest of the names which made it impossible to append without making them consistent, and you cannot tell it to just append on the position of the fields
- Merging tables was not as intuitive as I expected
- We were all querying from the same website so at some point we were denied access
- You cannot (we could not find the information) save the data that you obtained from websites as a file, so each time you make any change, add table, create chart or you want to save dashboard, you are querying the data from the website
- The time that it took me to bring 3 tables for 5 years, merge them and append took me almost 3h and I didn't do any data manipulation
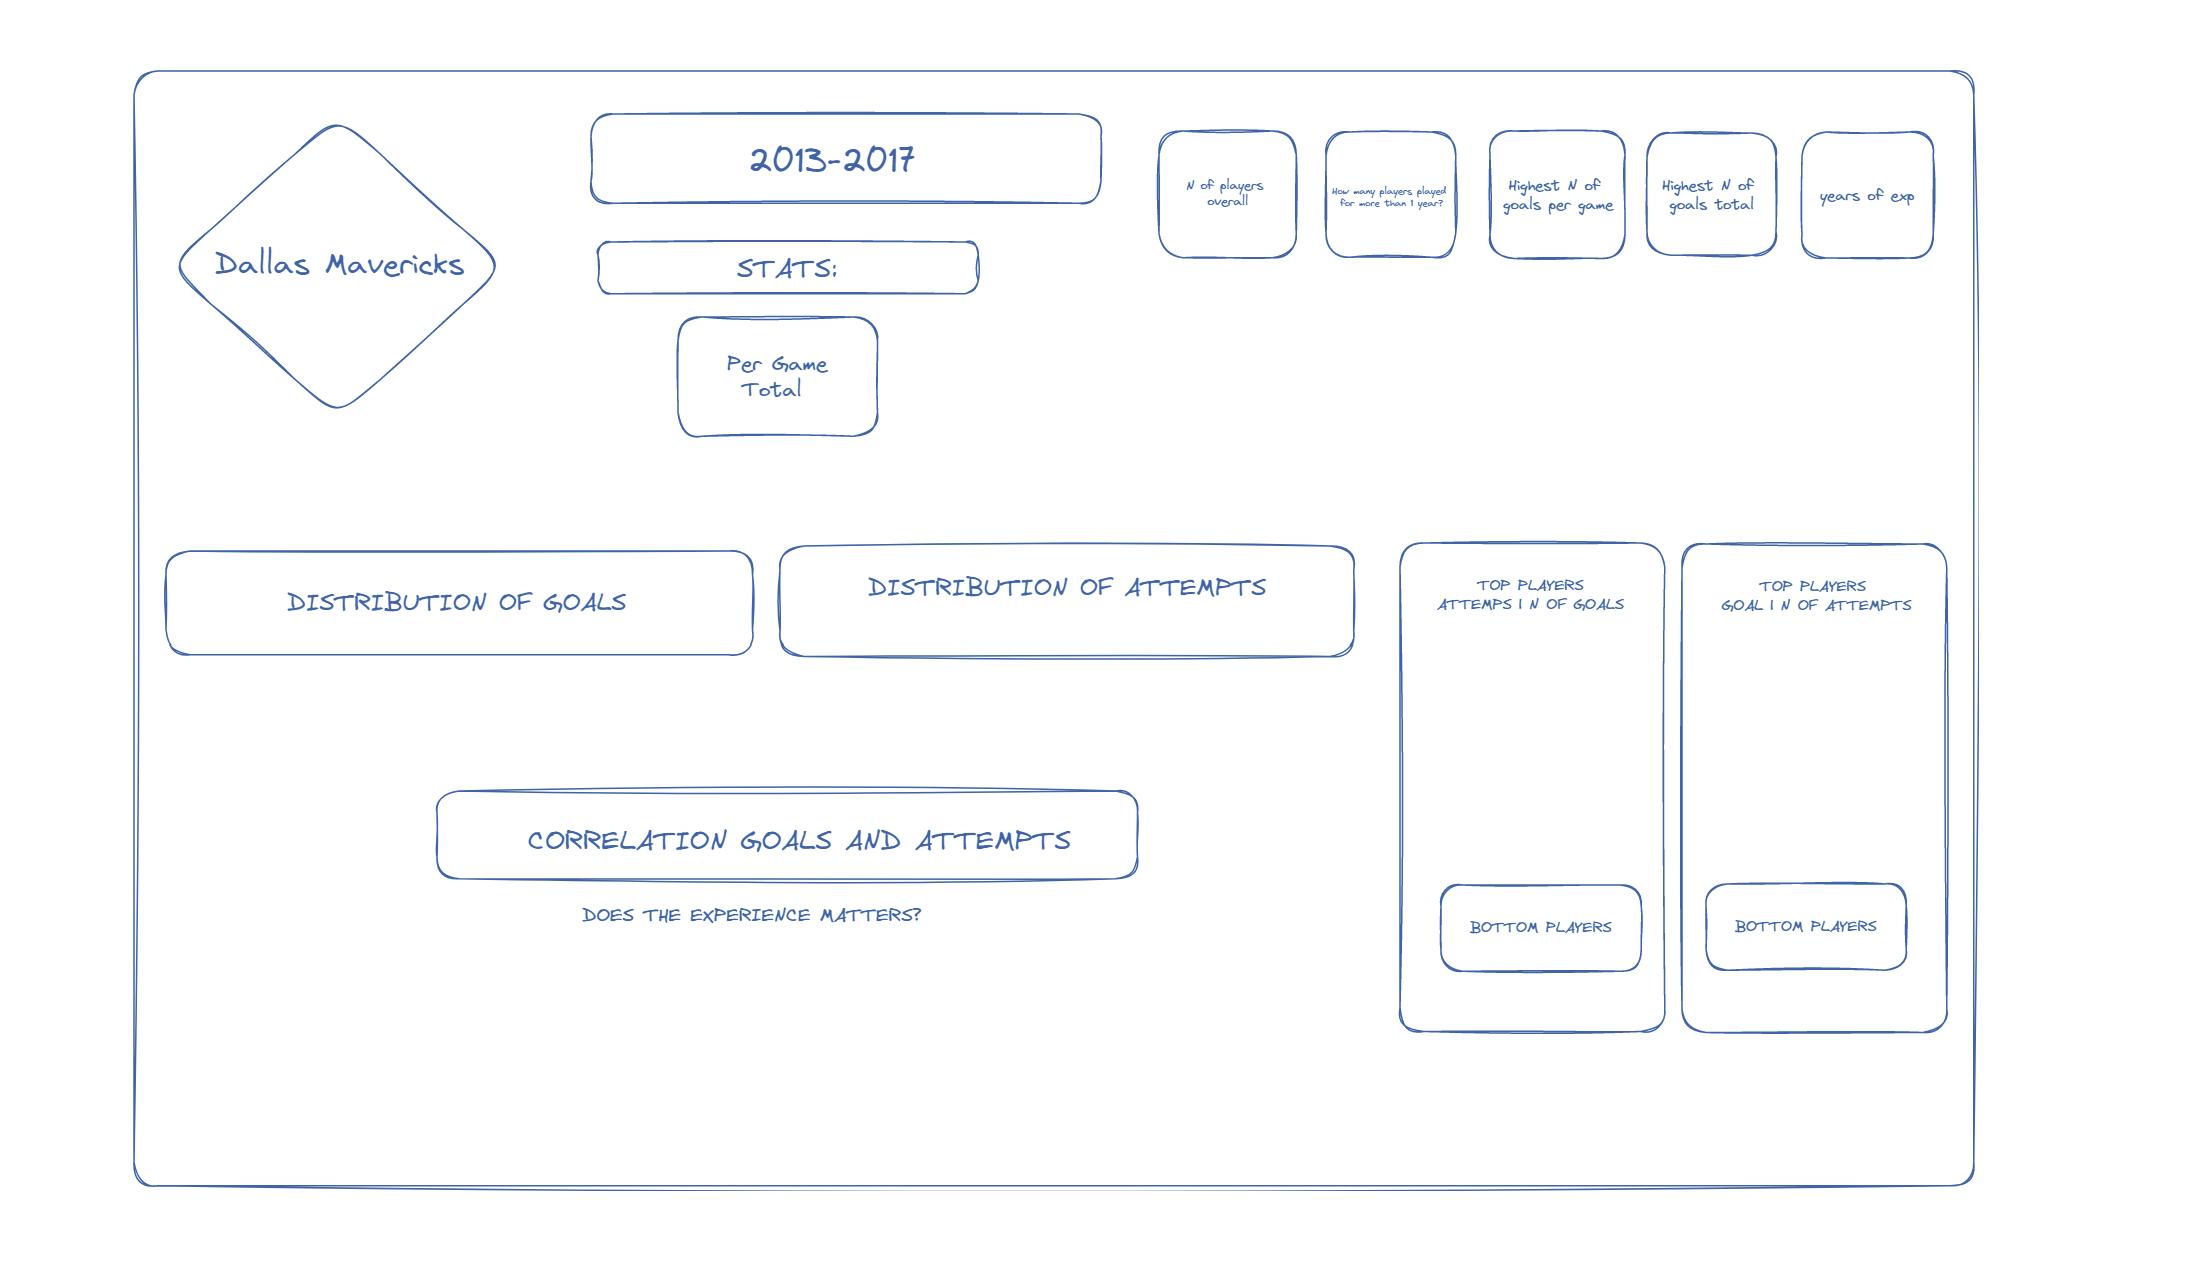
After bringing the data for Dallas Mavericks, drawing a sketch, I started creating my charts. Issue that I encountered was that the premade charts must have the amount of fields they were designed for. I watched some tutorial however they seemed to be outdated, having the newest version of the program, many charts structure changed since, so I couldn't follow the tutorial.
Today I had an idea what I wanted to present and how interactive it was supposed to be. Unfortunately, I didn't manage it at all. This experience opened my eyes what I can and cannot do with PowerBI and what I need to improve on.