


Task for today was to gather some information and examples about tools within Alteryx. Let me share what I and Kate found about some of those tools.
First two tools that I would like to talk about can be found in the Transform Tab in the Palette Tool.
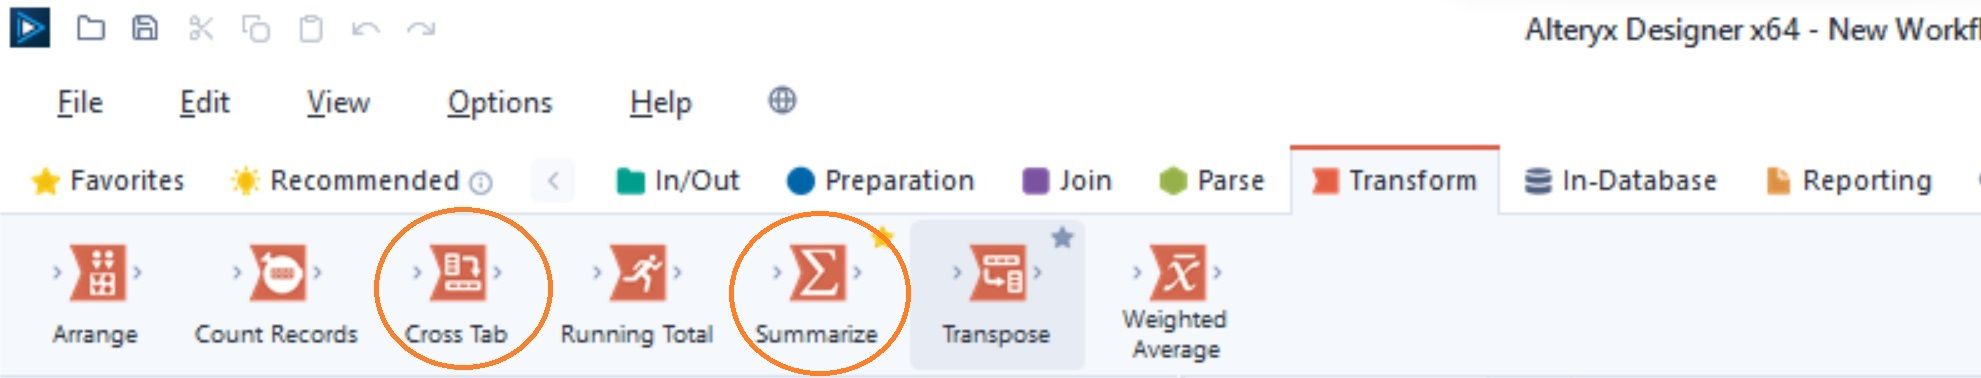

- Cross Tab
The Cross Tab tool creates one new column for each categorical value held in a single existing column, pivoting the data from a vertical layout to a more horizontal layout.
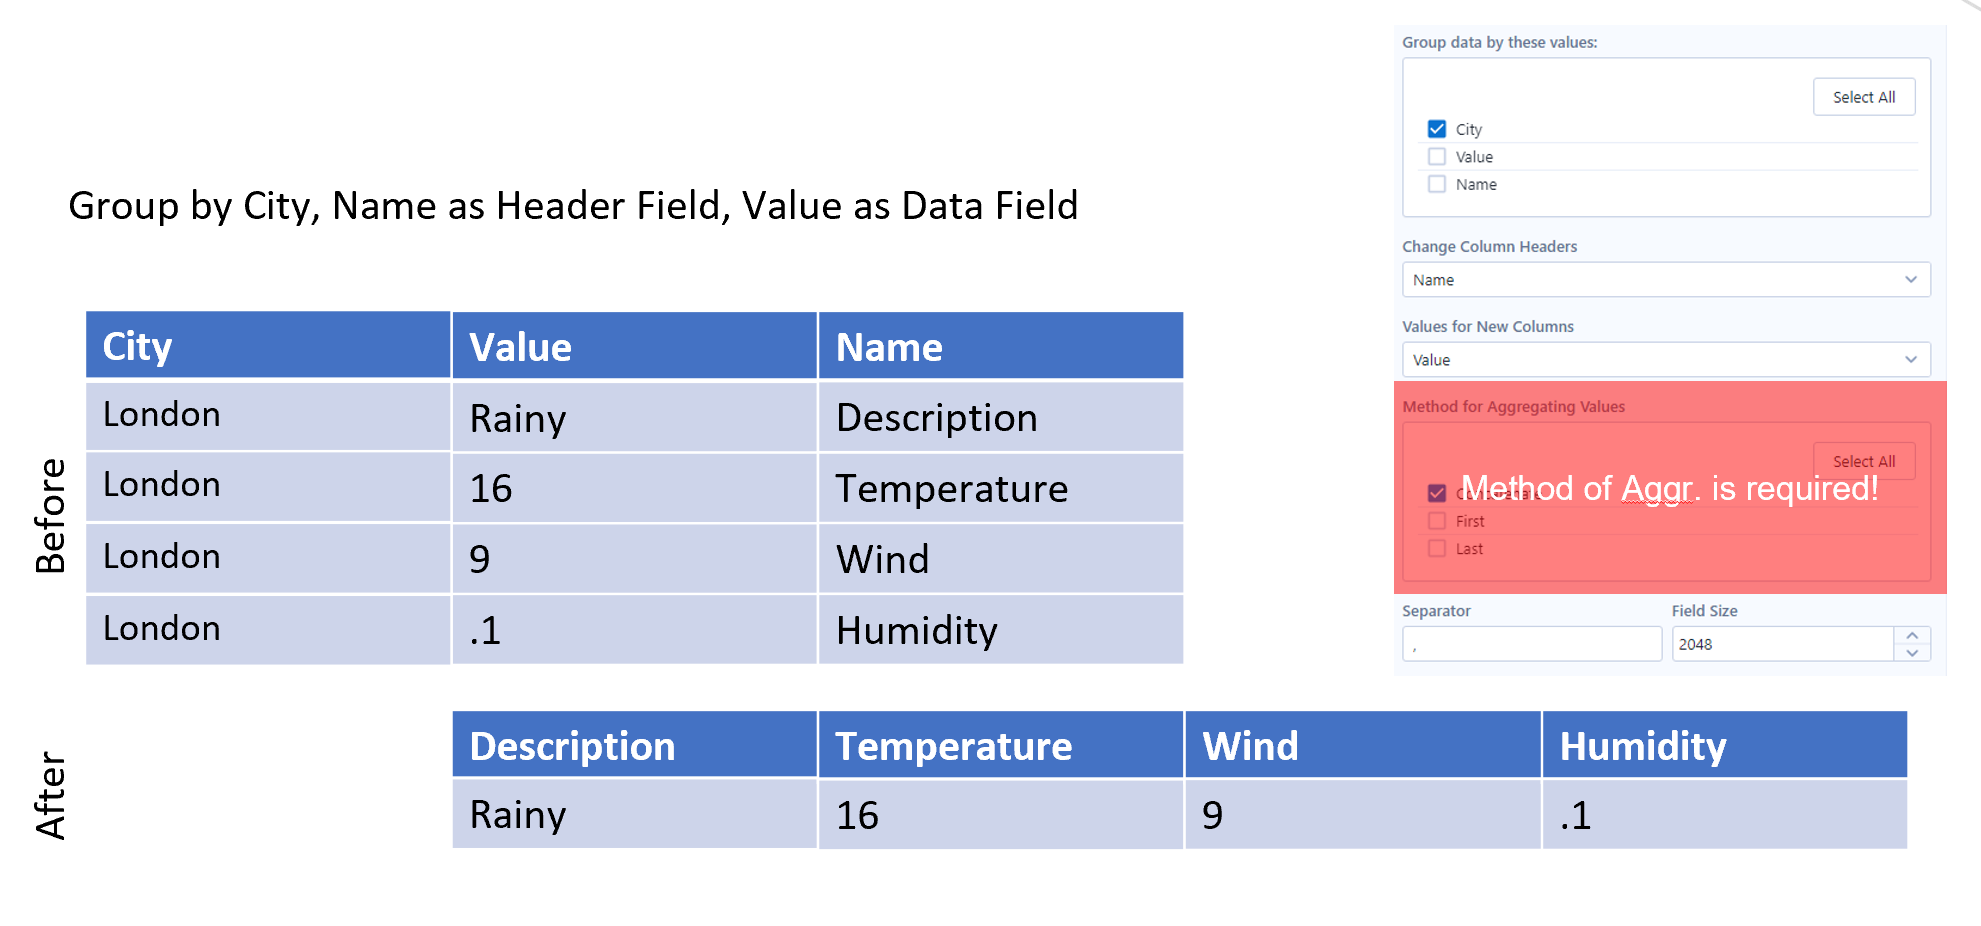
In the example above, instead of having City field repeated four times, we can pivot the table. When we join our data set with the Cross Tab tool, in the Configuration pane we would like to group the data by City and Concatenate the values.

2. Summarize
Summarize can:
- Return the sum for a column of data. The sum is calculated by adding all of the rows in the column.
- Return the minimum or maximum value in a column.
- Count the number of rows in a column.
- Group a column of data by identical values.
- Concatenate string values.
- Perform a variety of mathematical calculations.
- Perform spatial object processing.
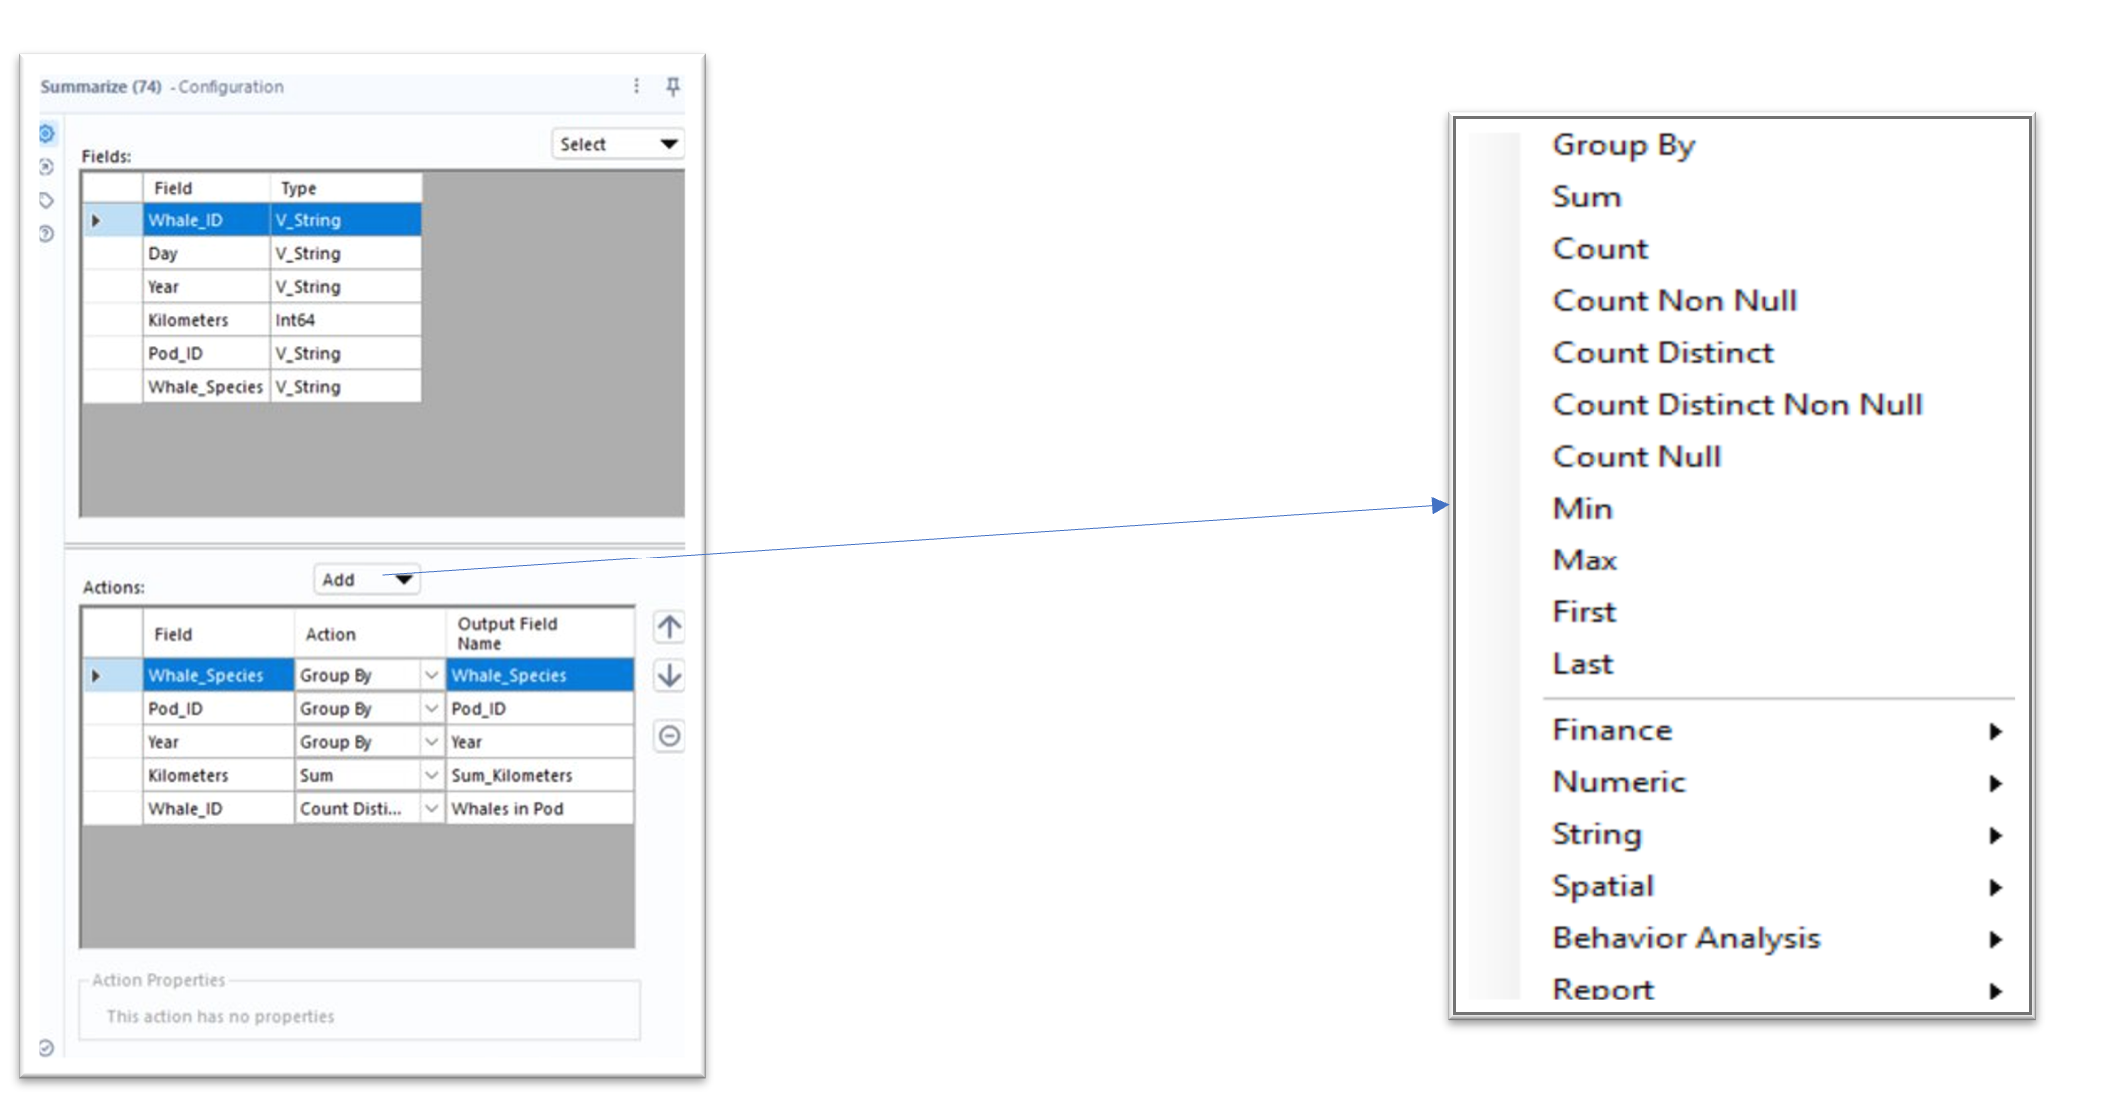
In the top section of the Configuration pane we can see all the available fields within our data set, as well as their data type. If we highlight one of the fields (Whale_ID), we can click on the Add and the whole new Action section appears, where we can choose what we would like to do with our field.
Next tool can be found in the Parse Tab.
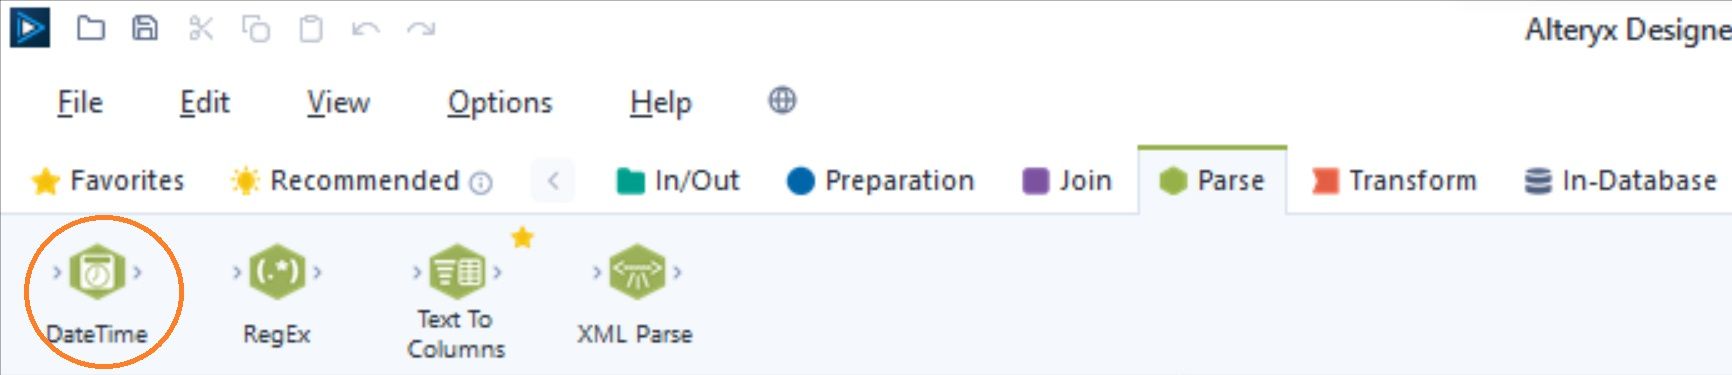

3. DateTime
The DateTime tool transforms datetime data to and from a variety of formats, including both expression-friendly and human readable formats.
There are 2 options:
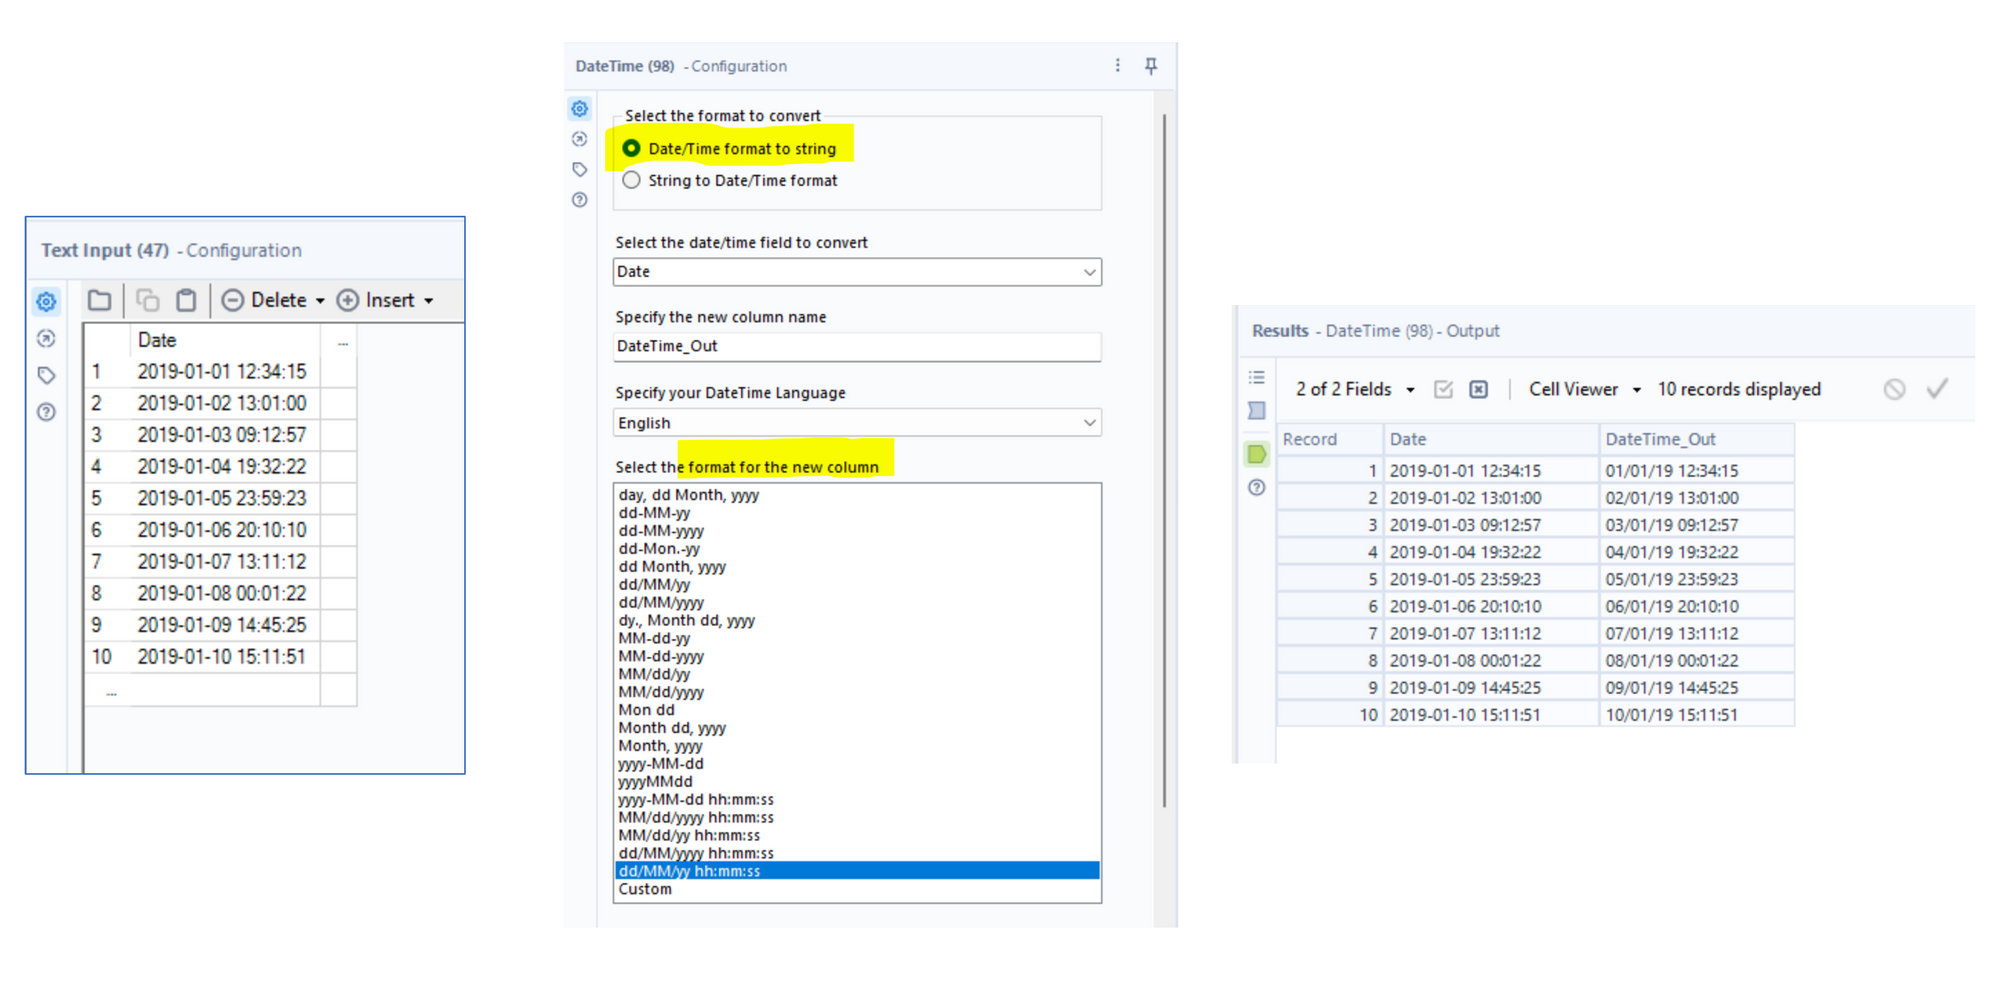
- Date/Time format to string: Converts the date-time data format to a string.
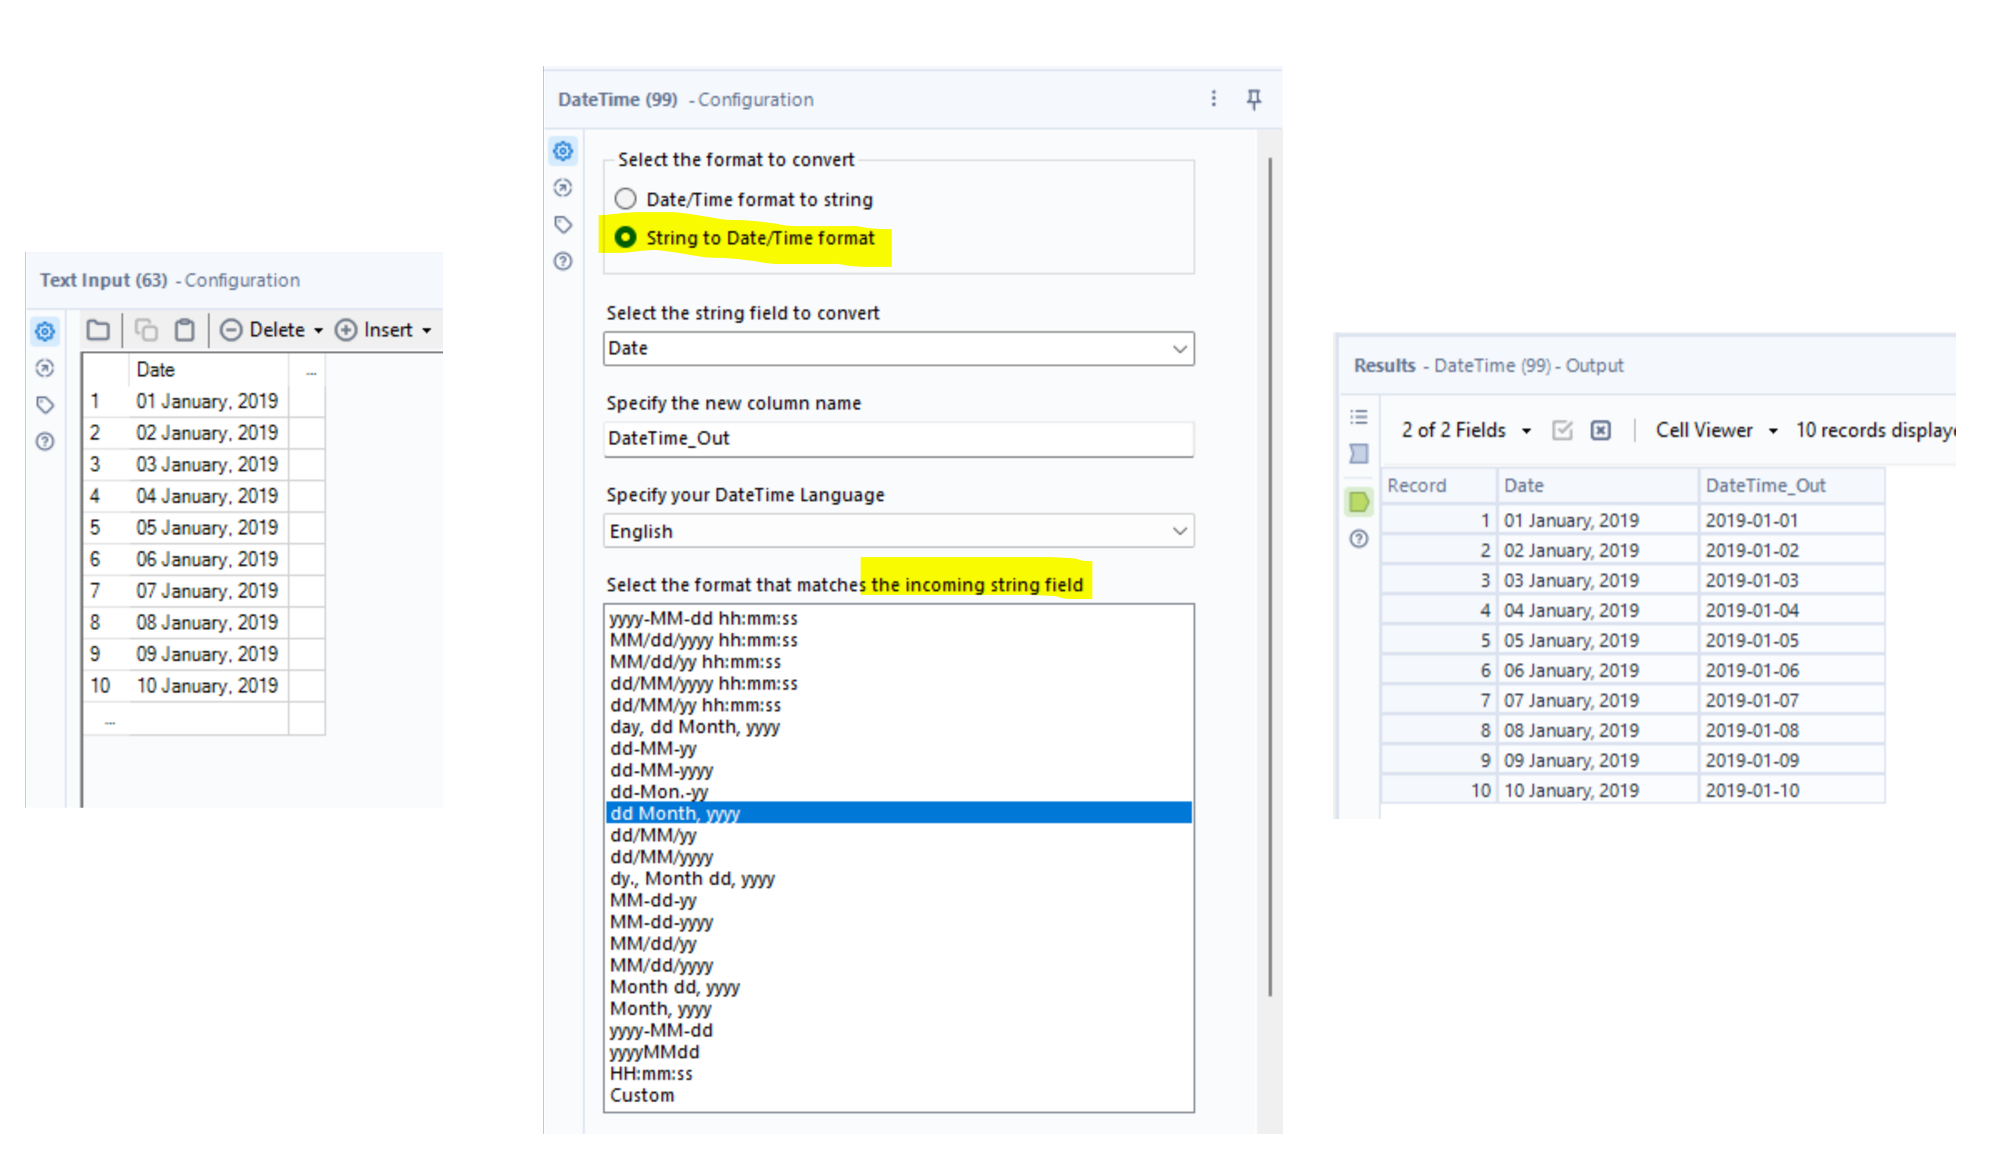
- 2. String to Date/Time format: Converts string data to a DateTime format
Case 1
Case 2

4. Tool Containers
Use Tool Containers to organize and segment tools on the Designer canvas. For example, you can use a Tool Container to prevent the contained tools from running with the selected segment of the workflow.
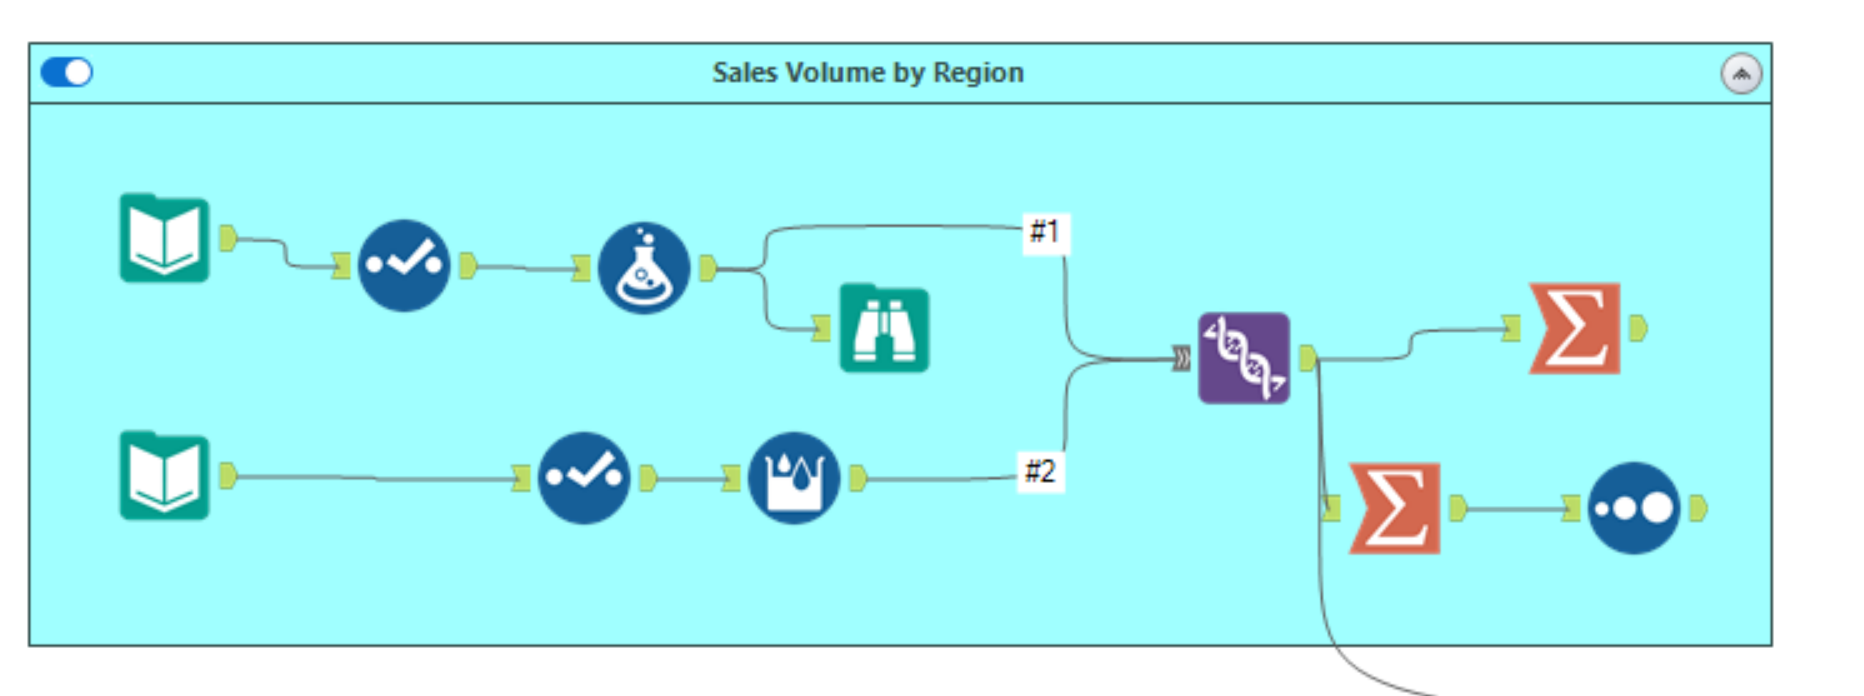
You can disable a container when you do not want to run a section or process in a workflow you are building. The disabled container remains expanded on the canvas and appears dimmed to indicate the disabled state. The tools within the container do not process data until enabled again. How to do it?
- In the container's Configuration window, check Disabled.
- Select the toggle at the top left of the container so the slider is to the left.
You can collapse a disabled container to hide its contents. Select the expand/collapse icon within the tool container to do so.
You can configure the look of your container in the Configuration pane, you can change the container's title, text, fil and border colour etc.