If you have a target you are trying to meet and you want to see your progress, you might want to create a chart with a reference line.
To make this chart, we have to:
- Create a calculated field.
We are going to create two separate calculated fields, one for our target, and one for the year we are tracking. We use the IF calculation to do this. In our example, our target is to beat 2020 sales, and we are tracking sales in 2021.
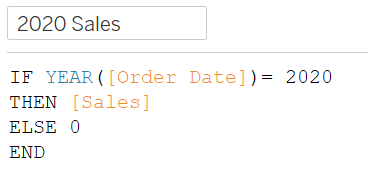
This is our formula for the target. As an English sentence, this formula is saying if the field we are looking at (which is the field with dates) has the year 2020 in it, then we want the sales information. If it isn't, then don't give us anything. And then we end the calculation.
We are going to do the same for our sales data from 2021.
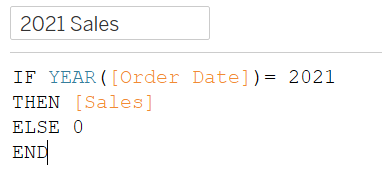
In English, this means if the field we are looking at (which is the field with dates) has the year 2021 in it, then we want the sales information. If it isn't, then don't give us anything. And remember to end the calculation.
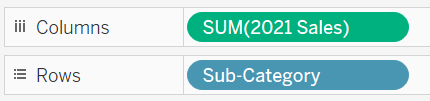
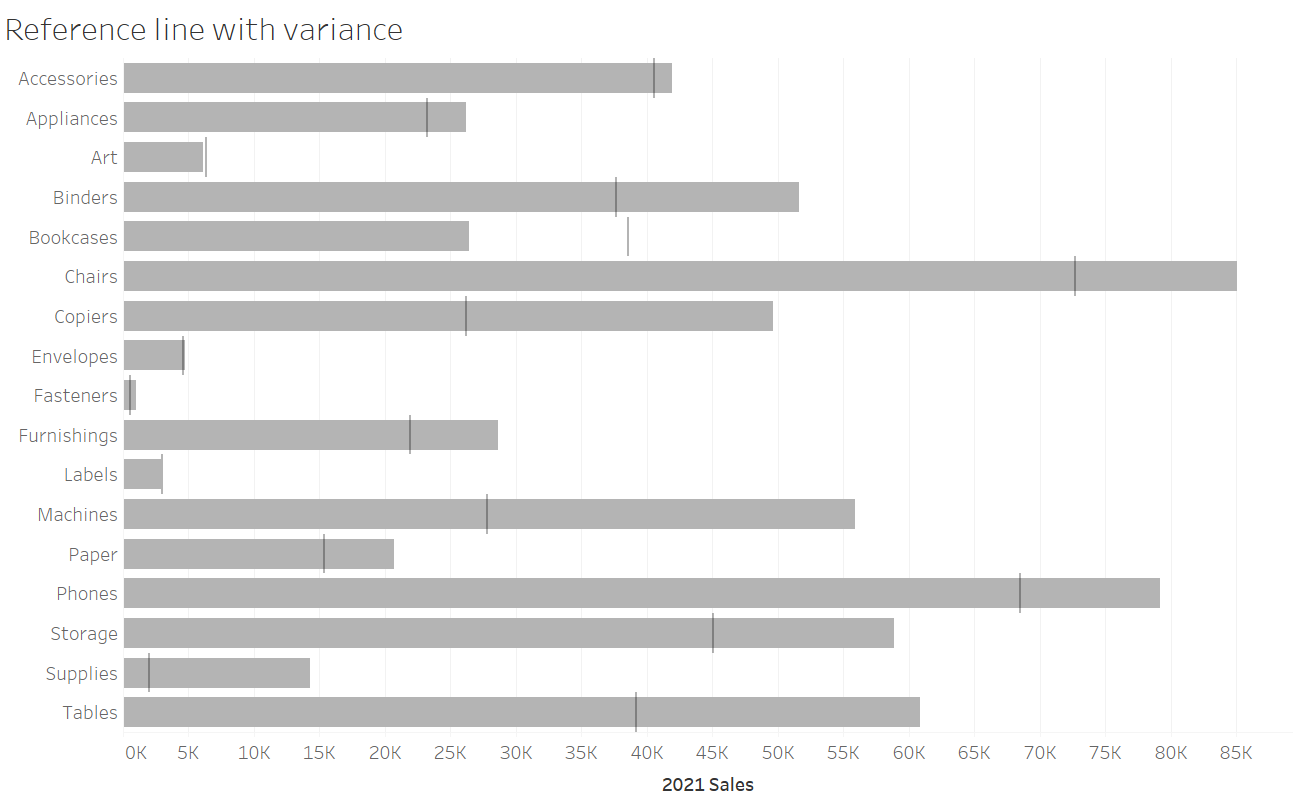
2. Drag the pills needed into the row and columns section
Drag the group with the items you want to view on to the rows section and calculated field (which was made in step 1) for the year you are tracking. In our case it's 2021 data
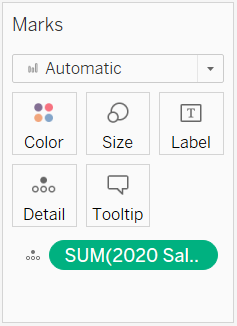
Then, in the marks tab, drag the calculated field with the target information (also made in step 1) into the details sections. In our example, is the data from 2020.
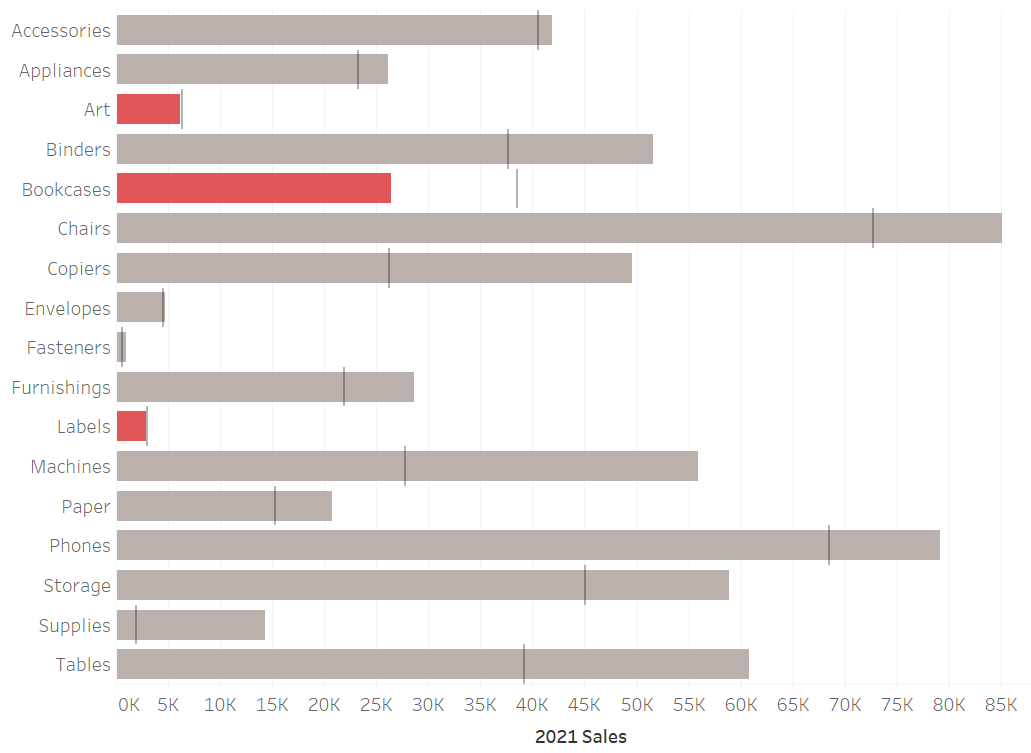
You should get something that looks like this.
3. Change the colour of certain bars.
You can choose the criteria you want for colouring bars. In this example, I want to easily see which products aren't meeting their targets. To do this, make another calculated field. We want to know when the sales in 2021 are less than the sales in 2020.
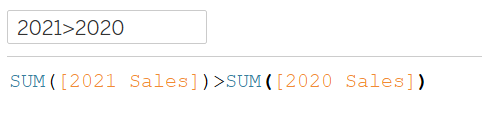
We will then drag this calculated field on to the colour section of the marks card.

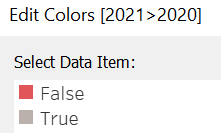
Lastly, click on the colours tab and edit the colour. We want to keep all the numbers that meet the criteria set in the calculation grey, and only change the number of those that don't meet the calculation. In other words, if the value for 2021 is greater than 2020 then that bar should stay grey, but if the value for 2021 is NOT greater than 2020 then the bar needs to be in red.
When you have set everything correctly, you should get the image below with three items not meeting the target.