I was excited when I found out today was an API day. Not just any API, but NASAs APIs. I was picturing space visuals, stars, planets, asteroid trajectories and all of that good stuff. Since NASA has around 17 available APIs I started the day by reading about them and what is available. The first one that caught my attention was the Insight Mars Weather Service API and I tried to connect to see what data could be downloaded but after about 40 minutes of maximum effort and no usable data I realized it time to try something else.
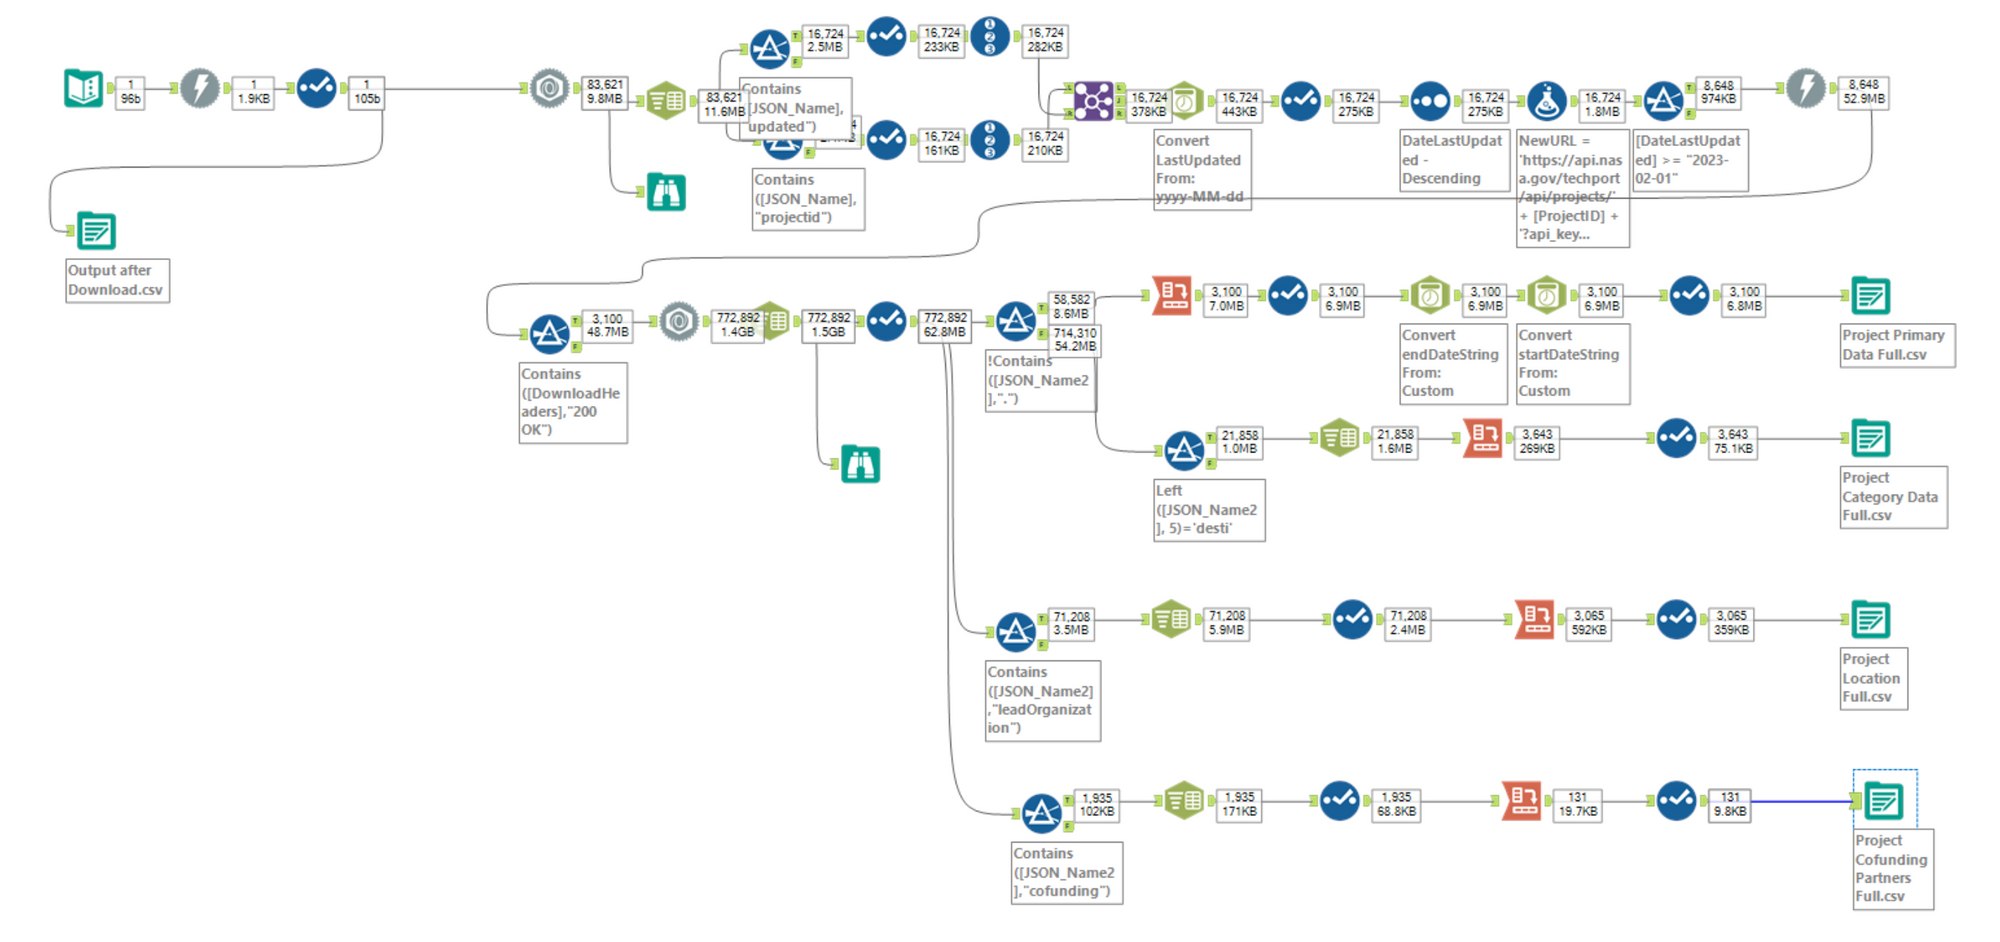
I moved on to the Techport API which provides information on technology projects NASA has or is working on. I was curious to see how much data I could get and what type of information they make publicly available. It turns out it is a lot and I spent most of my day working on the flow in Alteryx and picking certain parts of the data that could help me build a dashboard by the deadline. This is the final flow with 4 data outputs containing information on type of projects, location, co-funding partners and scope:

The full list of projects included over 10000 records but not all of them had all of the information available and there was also an API limit that was reached multiple times throughout the day. Each project had its own URL to call. While working on this I initially only downloaded data for approximately 840 projects and used that to build my dashboard but I adjusted the flow to download as many as possible while I was working with the records I had. The final version took close to 2 hours to run and had information on 3100 projects. There was a lot of information available for each project and I spent close to 1 hour reading through and trying to understand what exactly would be useful and what could be filtered out.
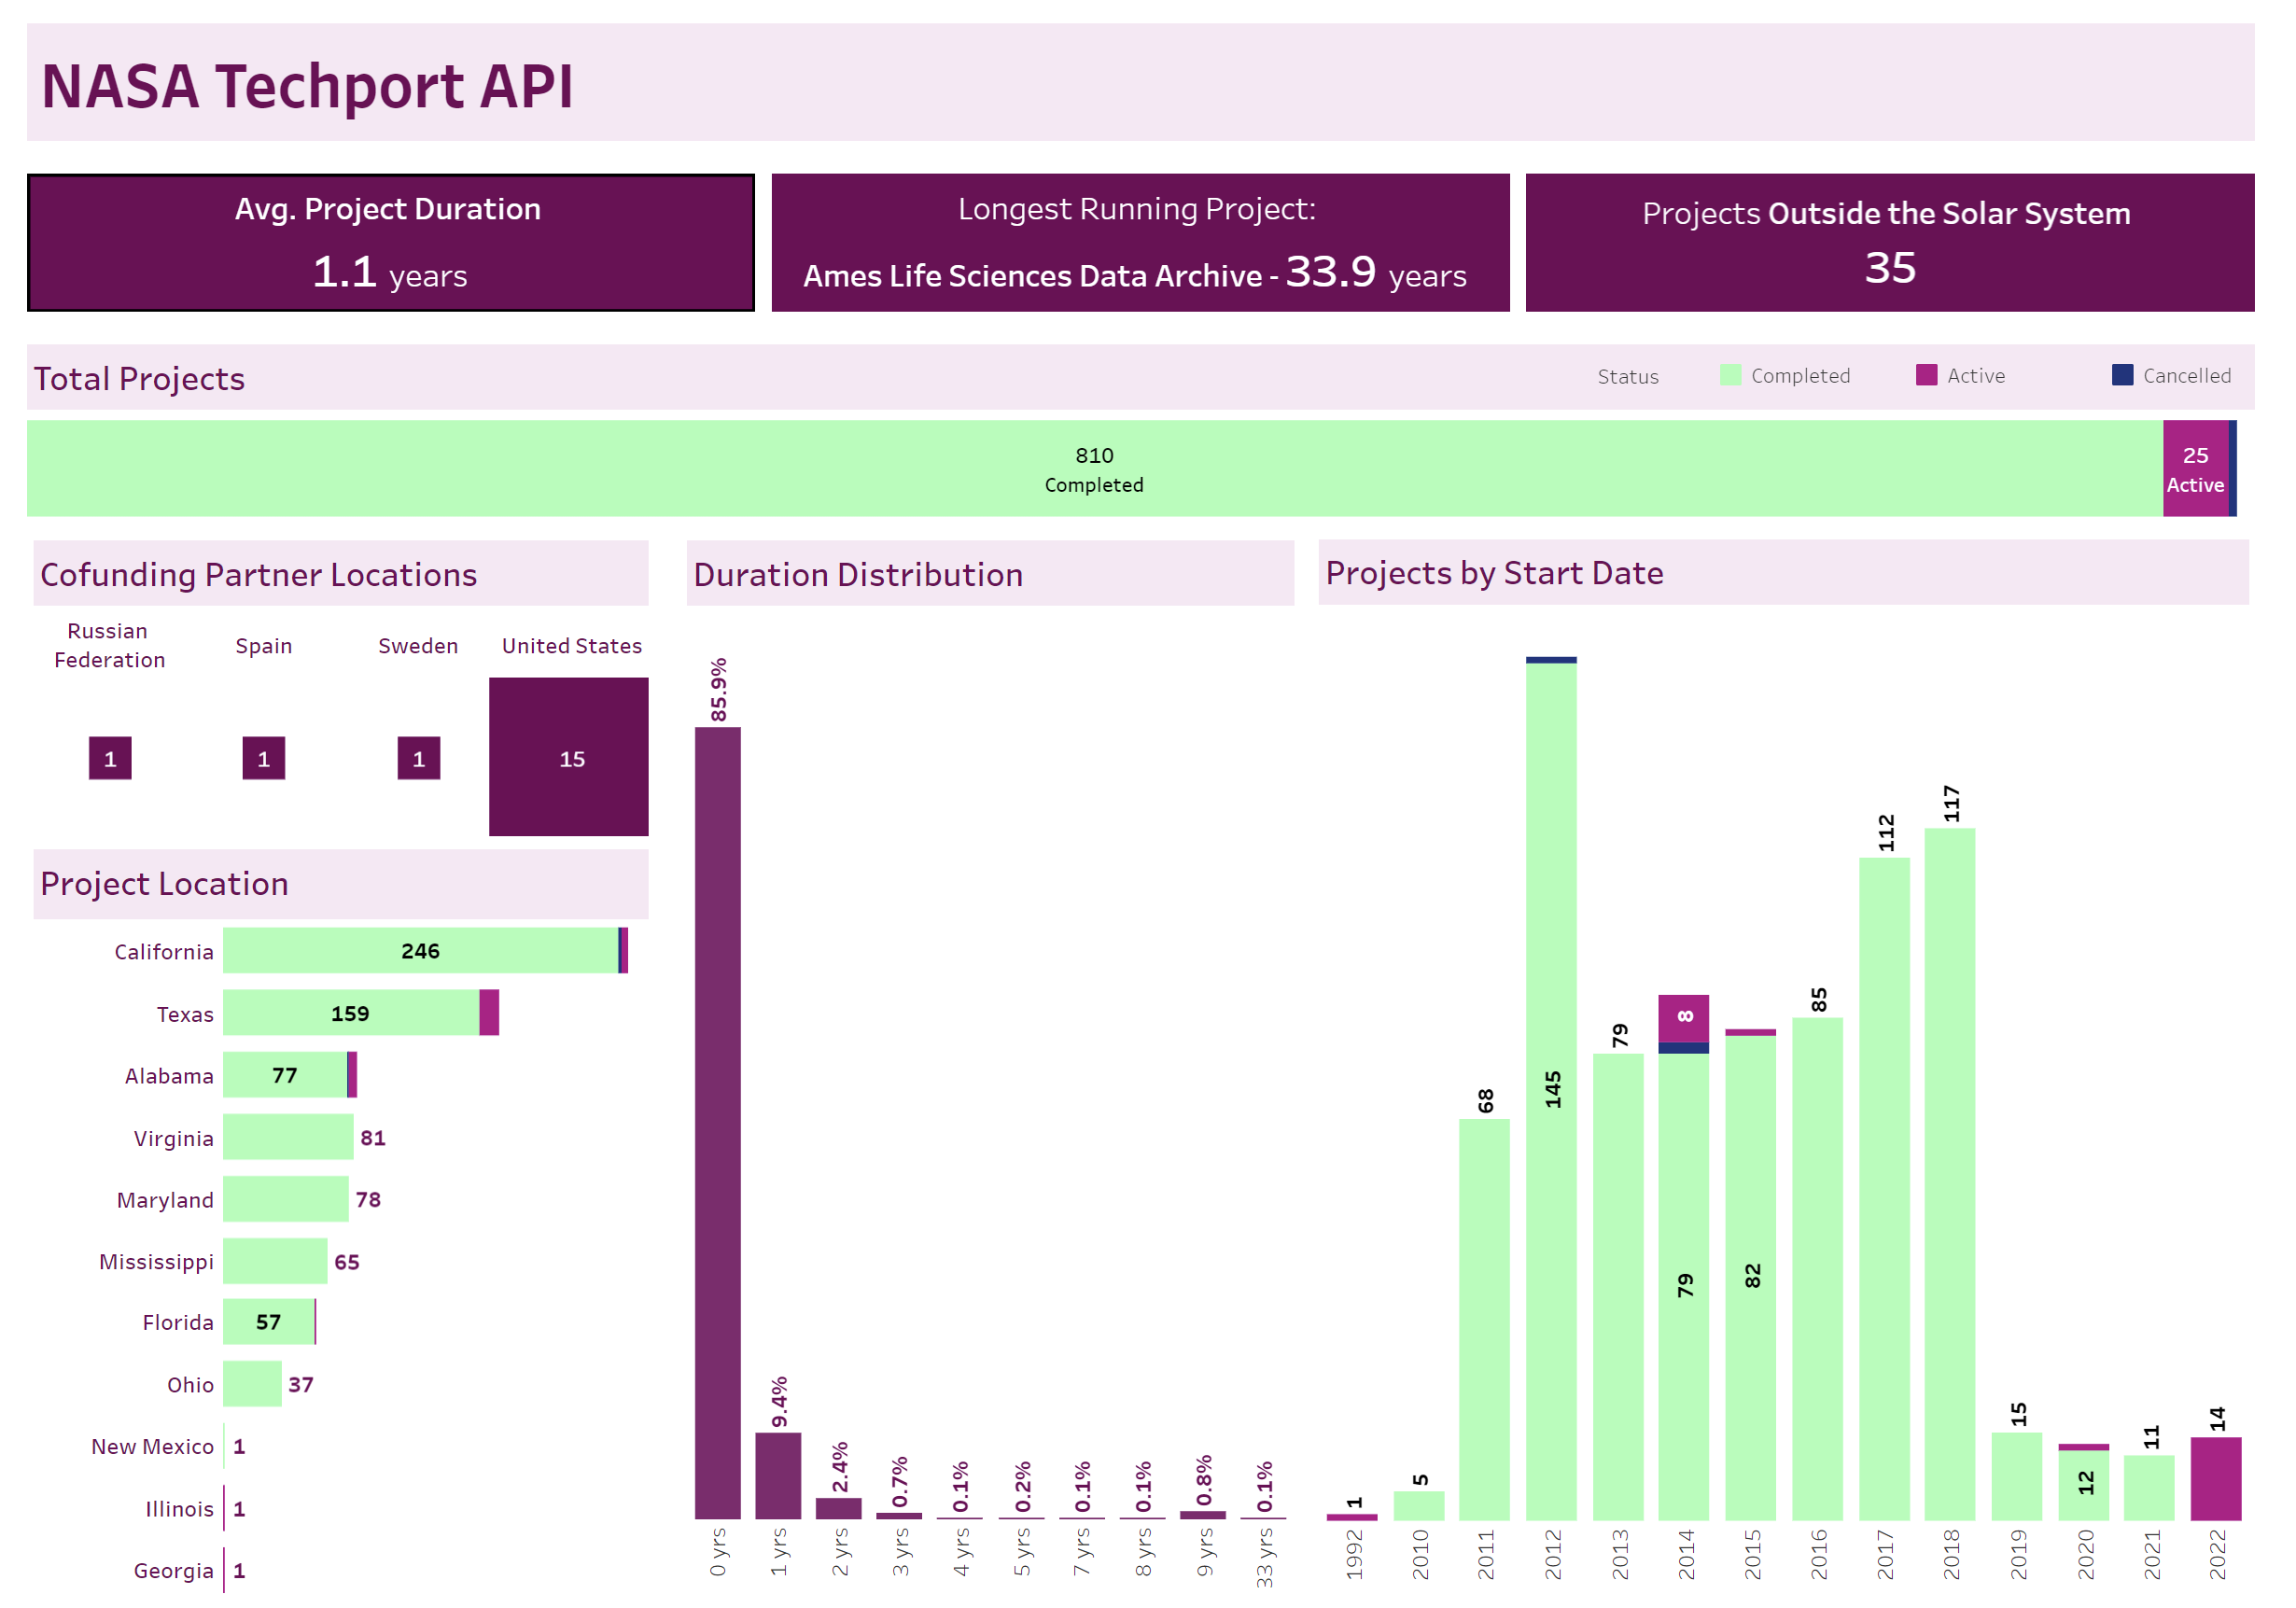
The most interesting part I was planning on using were the description and briefs for each project where I could perform a text analysis but due to the tight deadline I scoped it down to more of an overview. This is the initial version:

And this is the version with all of the data the flow downloaded:

There is definitely room for improvement in this but I'm glad I managed to get the workflow working. This week and particularly this day have really helped me understand the importance of project boundaries and scoping. If I would have given up on parsing the data and moved on to try another API I probably would not have had a dashboard to present at the end of the day.
