


What is a P-Value?
A P-value, also known as a probability value, is a numerical indicator of how likely it is for the facts that you have to be the result of random chance (i.e. that the null hypothesis is true). A p-value between 0 and 1 is frequently used to represent the degree of statistical significance. The evidence to reject the null hypothesis is stronger when the p-value is lower.
When can we use it?
A p-value is typically used to test the null hypothesis. The null hypothesis suggest that there is no correlation between the variables being investigated.
If the null hypothesis will be rejected in favor of our alternative hypothesis, our p-value is determined to be significant . If not, we don't reject the hypothesis.
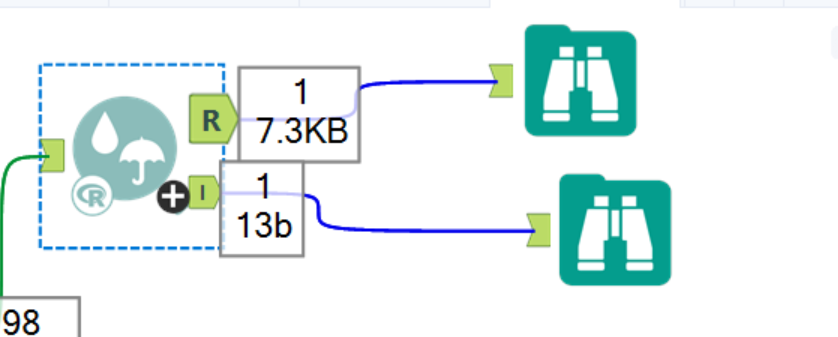
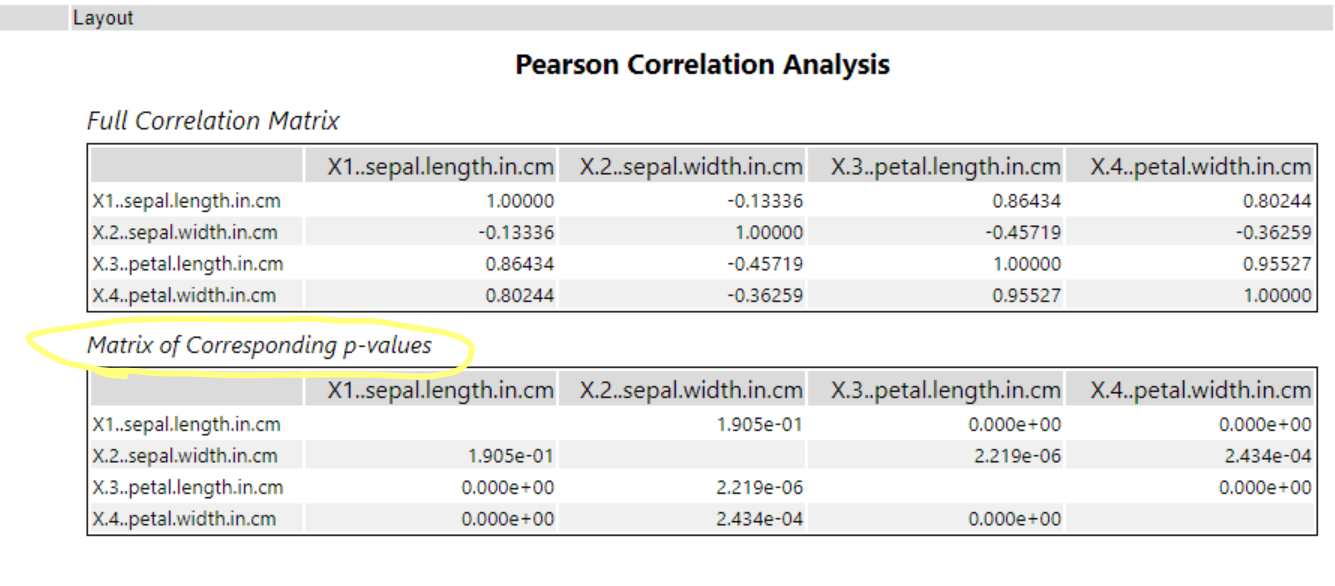
The easiest way to find out the P-Value is to use the Association Analysis tool. You can select here the fields that you want to see correlations between.
In today's session we've used the "Iris Clean" dataset. Then, we've dragged a Association Analysis tool so we can configure the pearson correlation.

Then, I've put the target fields to be measured with the pearson product-moment correlation and put two browse tools near for the final view.
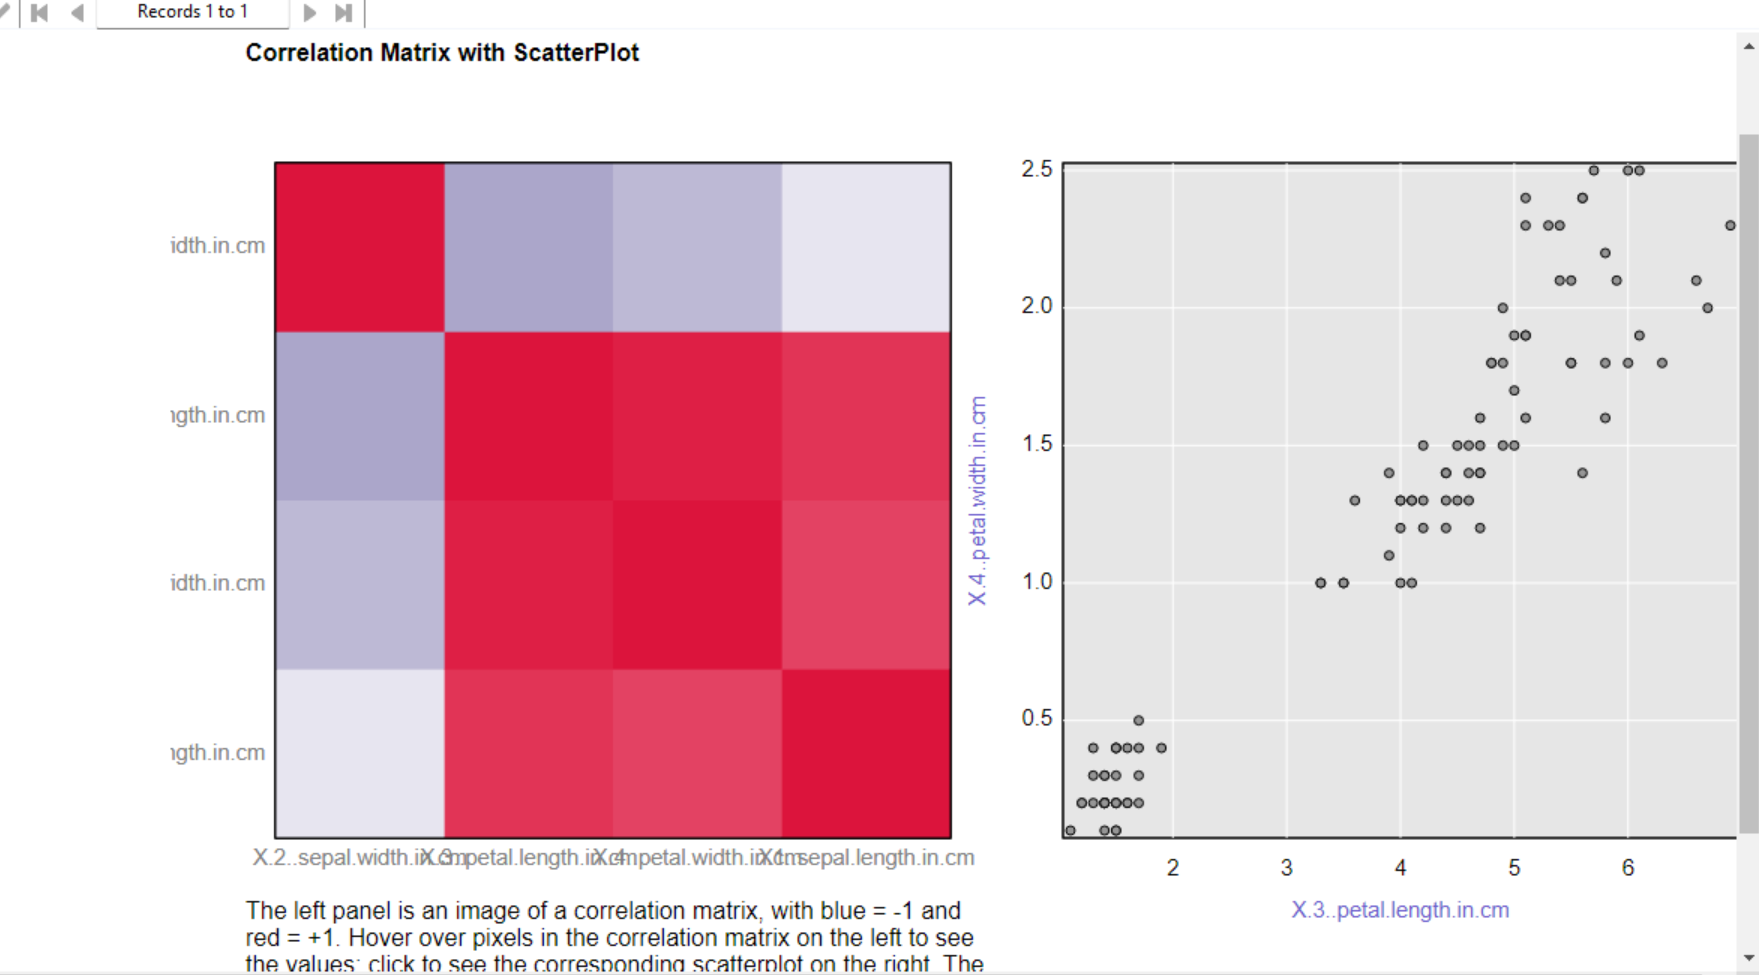
The graph from above is like a heatmap with values between -1-+1. The blue color represent small values and red color represent the high values.
By clicking on a square in the heatmap you can have the relationship to appear on the right chart. The right graph illustrates the width and the length of a sepal and petal, two plant parts.