Today we've learned how to create a Sparkline with Indicator in Tableau with "decrease" and "increase" feature for the previous and current month.
We've used the Superstore dataset for this example and created three calculations for the final result.
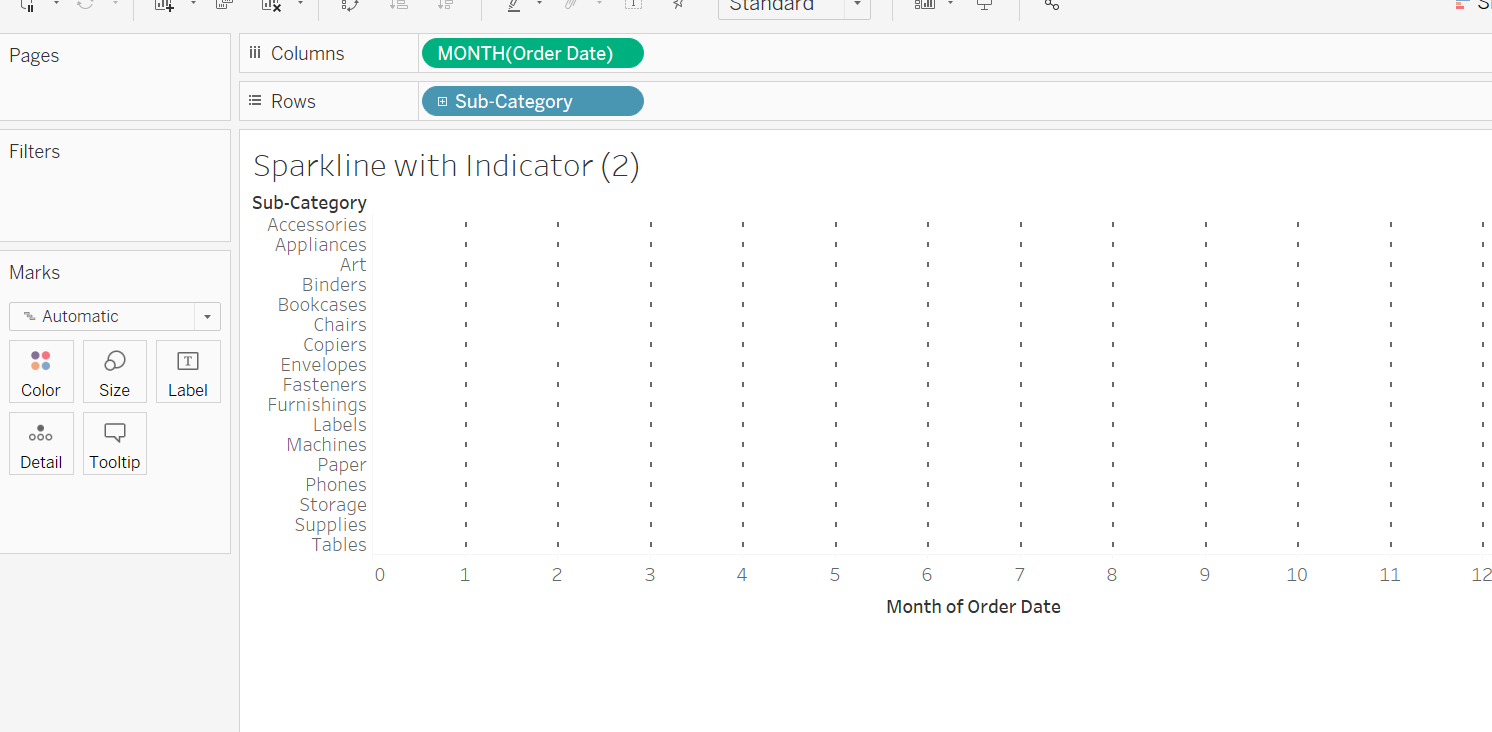
You simply need to drag the Month ( Order Date) into collumns and make it continuous. Then drag Sub-Category to Rows.
Then we need to create two calculations: Current month and Previous month. For Current month you need to write: IF LAST()=0 THEN SUM([Sales]) END. For Previous Month the calculation should be IF LAST()=1 THEN SUM([Sales]) END.
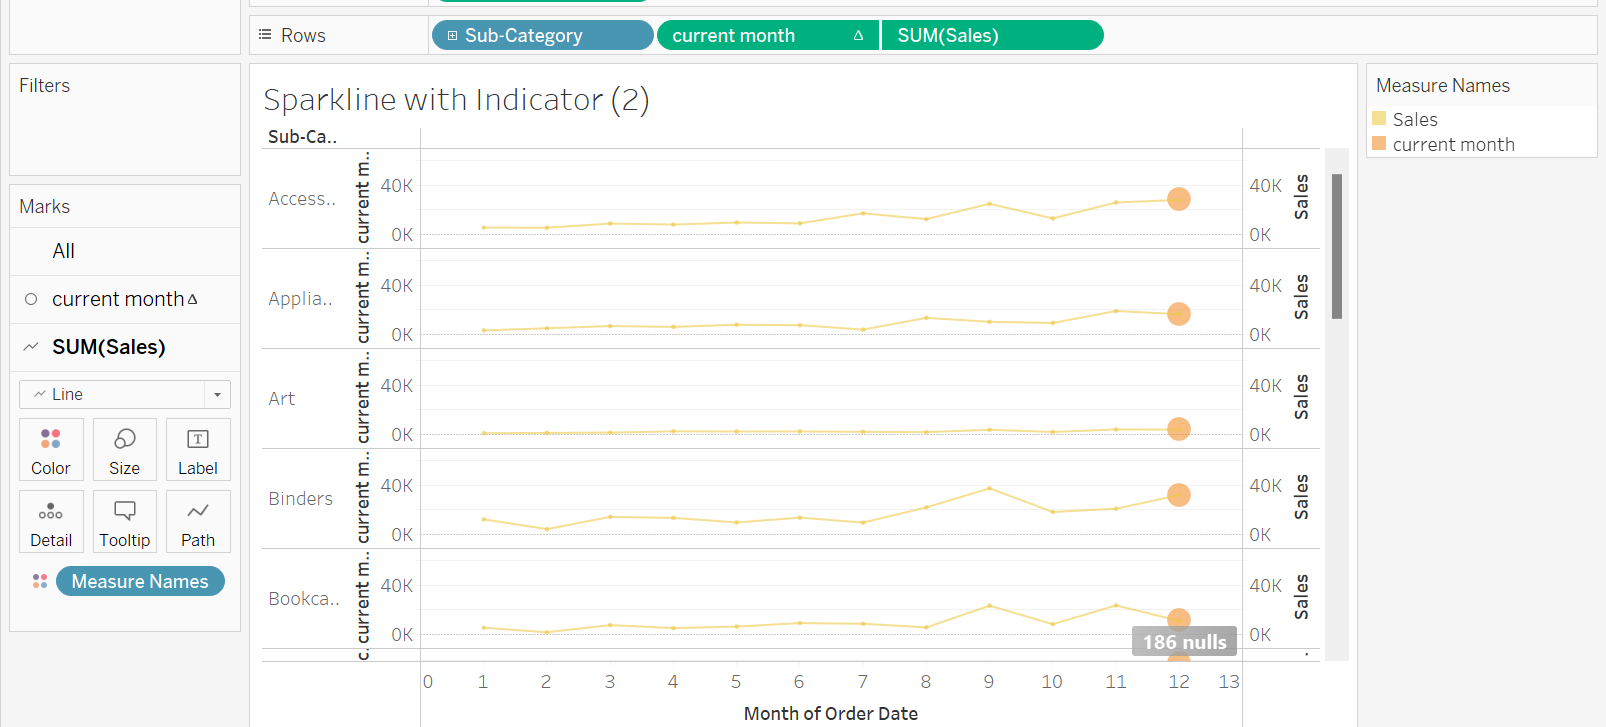
Then drag the Current month calc into the rows and drag the sales near and make it a dual axis. Don't forget to synchronize the axis.
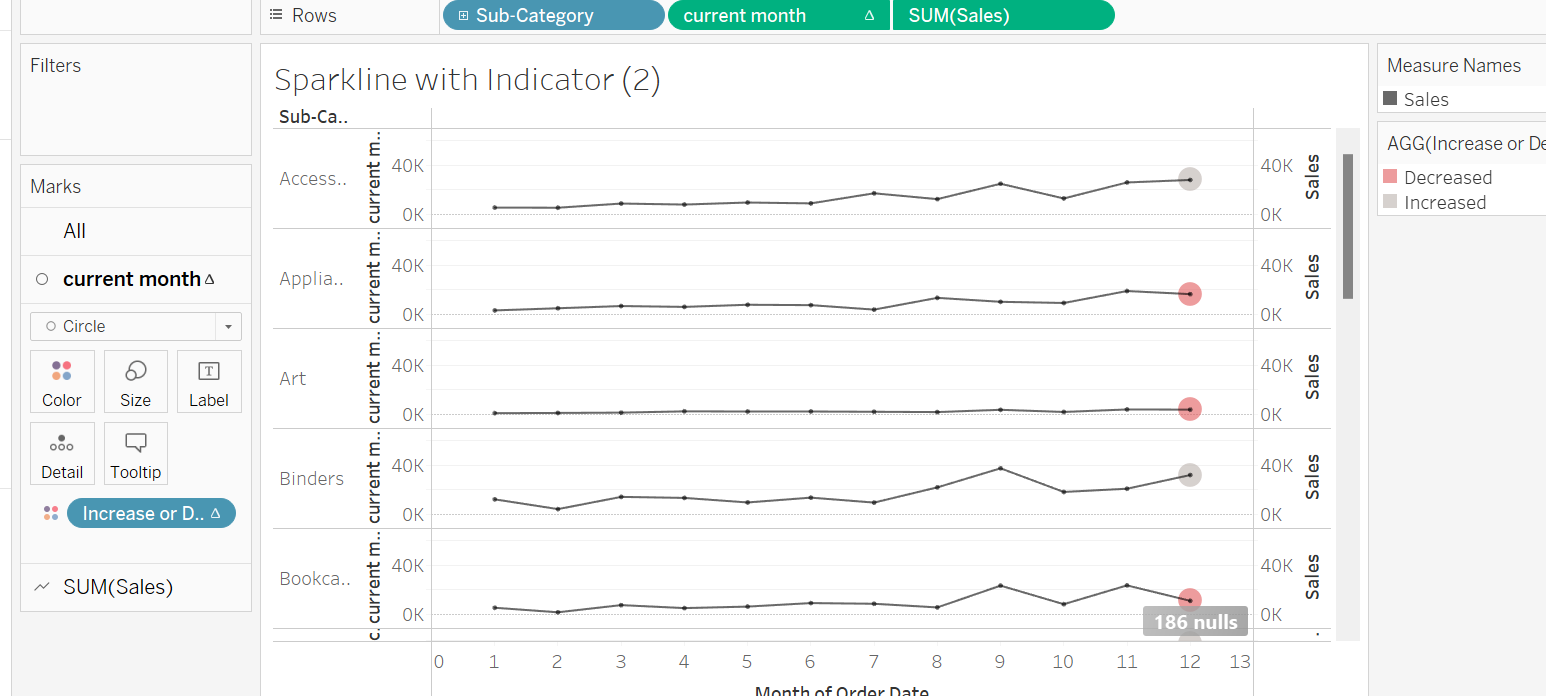
Then make the Current month field as a circle and SUM(Sales) as lines.
After that we need to write the other calculation for "Increase" or "Decrease" fields:
IF WINDOW_MIN([current month])<= WINDOW_MIN([previous month]) THEN "Decreased"
ELSE "Increased"
END
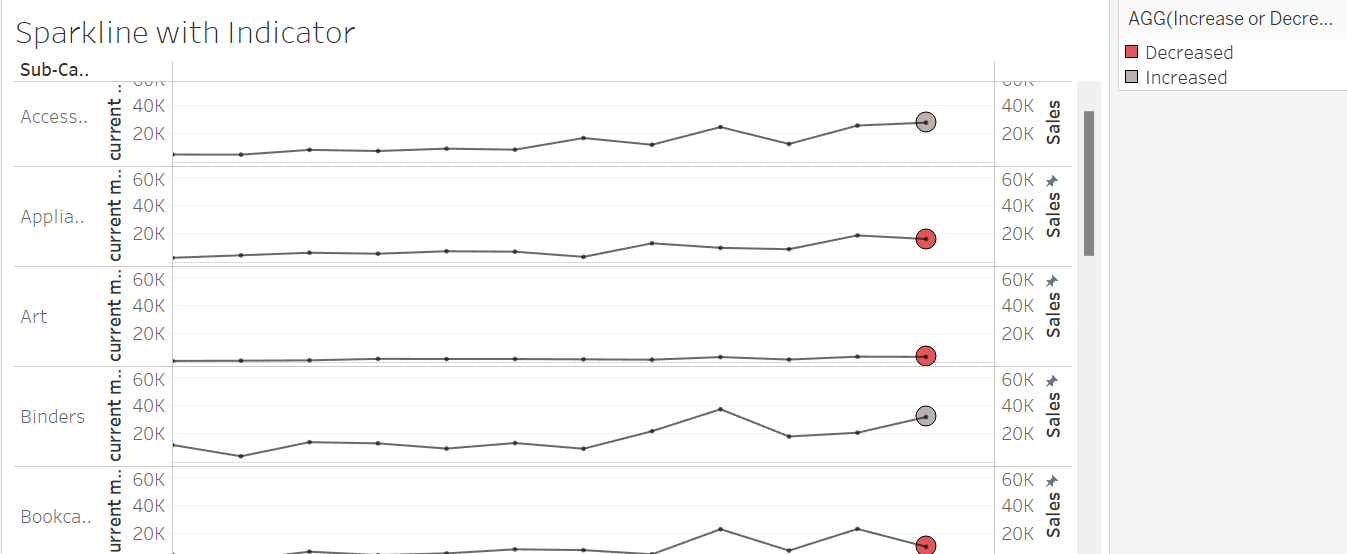
Then, drag the calculation into the colour for the "Current Month" field and you should be able to see the following result: