


A table calculation in Tableau Desktop is a transformation you apply to the values in a visualization.
Unlike calculated fields and level of detail (LOD) calculations in Tableau Desktop that look at the entire data source behind the scenes, Table calculations only care about the rows, columns, and numbers that are currently sitting in the worksheet. They are based on what is currently in the visualization and do not consider any measures or dimensions that are filtered out of the visualizations.
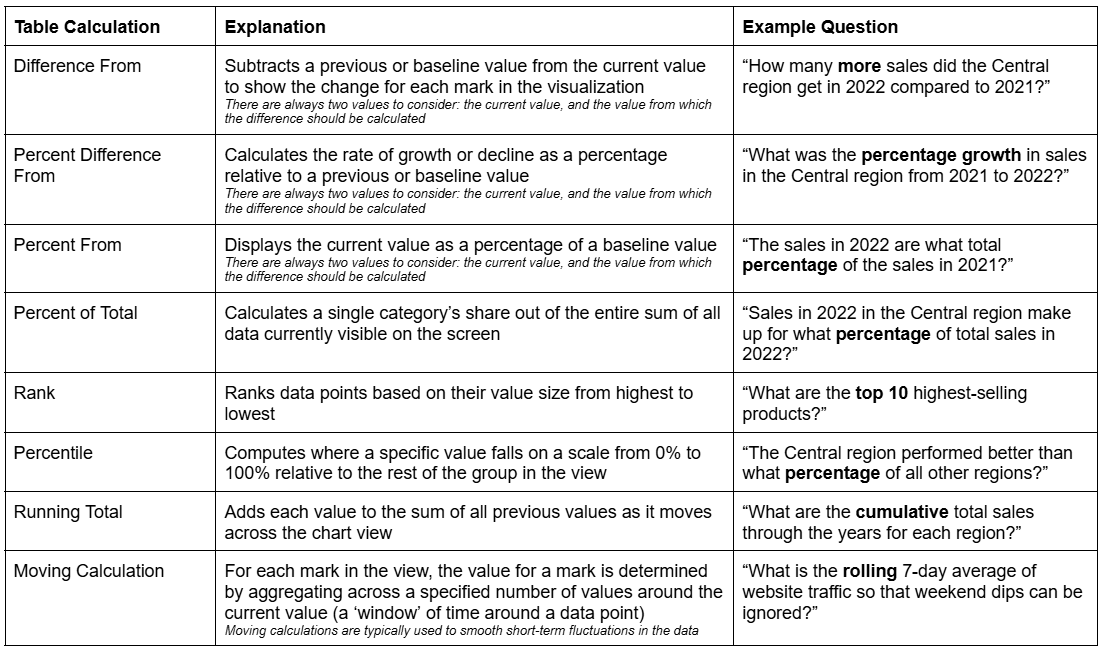
Types of Table Calculations in Tableau Desktop:
How to use Table Calculations in Tableau Desktop:
A quick reminder: ‘blue pills refers to discrete fields and ‘green pills’ refers to continuous fields.
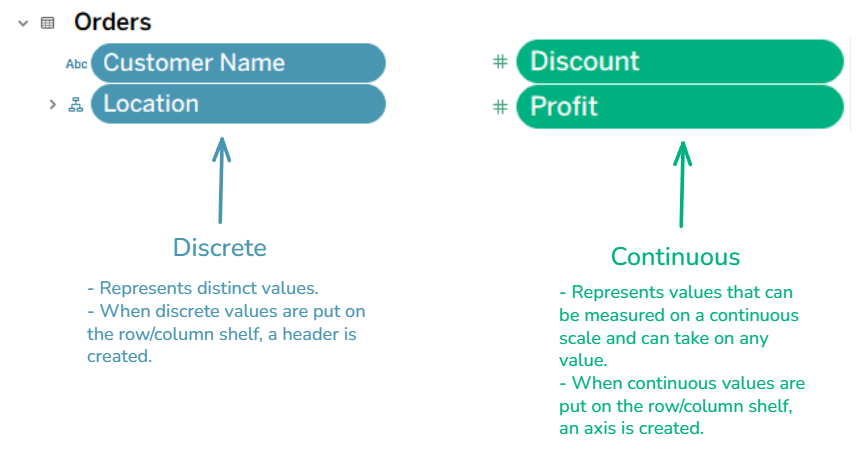
Discrete vs. continuous fields are not to be confused with dimensions vs. measures! Dimensions are qualitative data (characteristics, attributes, categories). Measures are numerical values you want to aggregate (sum, average, count, etc.).
Dimension: slicing or grouping
Measure: aggregating or calculating
Discrete (blue): you see headers/labels
Continuous (green): you see an axis
Step-by-Step Guide to Table Calculations:
- Create a visualization
Before you can do a table calculation, you must have a visualization (table, chart, etc.) in the view for Tableau to be able to compute a calculation.
- Open Tableau Desktop and connect to a data source (I have used Sample-Superstore).
- Open a new worksheet.
- Drag the fields that you would like to visualize onto the view
Note: you must have at least one measure in the view for Tableau to complete a table calculation. You cannot do a table calculation on a dimension (in this case, my measure is 'Sales'.
First step to creating a table calculation in Tableau Desktop
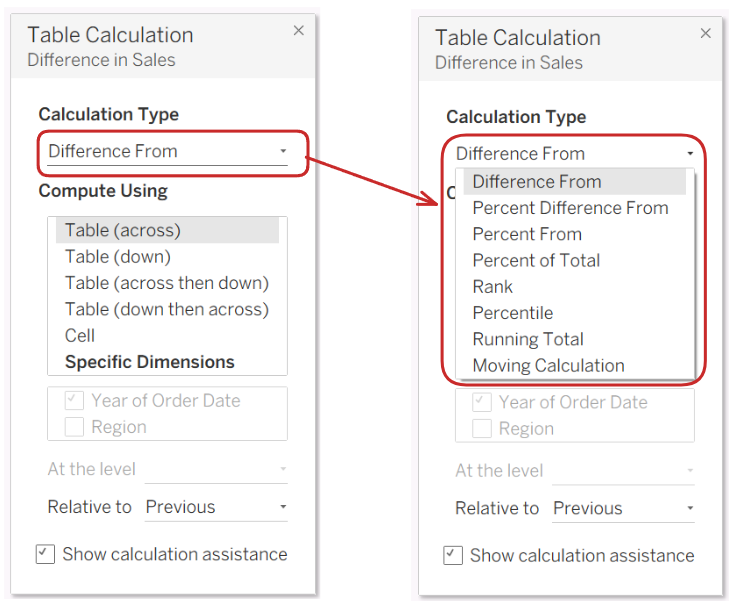
- Create the Table Calculation
- Right-click on the green measure pill in the view and click ‘Add Table Calculation’.
- Select the ‘Calculation Type’ you’d like to compute and how you’d like Tableau to calculate it (‘Compute Using’). This will change how Tableau creates the calculation, and is very important.
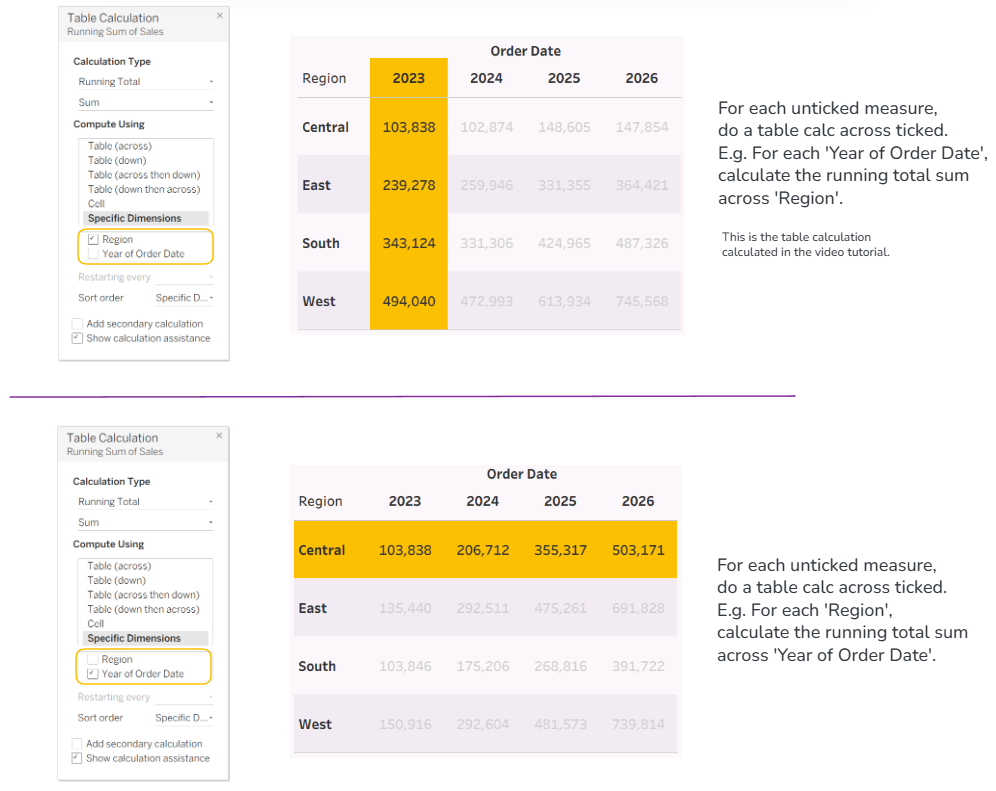
For this example, I’d like to calculate the running total for each year across regions. In other words, add up the sales across all regions for each year.
Second step to creating a table calculation in Tableau Desktop
- Sense-Check the Calculation
Arguably the most important step!
- Add values into the view to validate that the calculation is correct (i.e. adding labels (if you have a chart)).
Once you have created a table calculation, you'll see a symbol next to the measure.
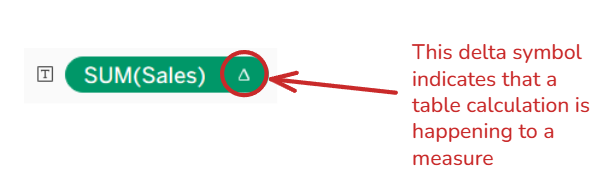
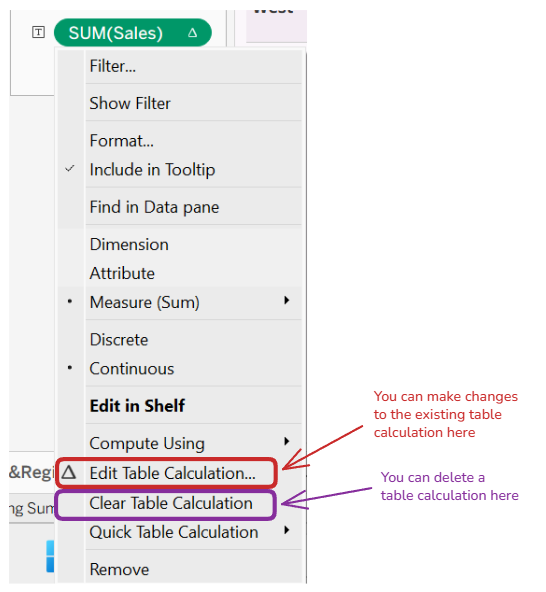
Table calculations crop up a lot when dealing with data and visualizations, so it's useful to have a go at using them to fully understand what is happening behind the scenes!