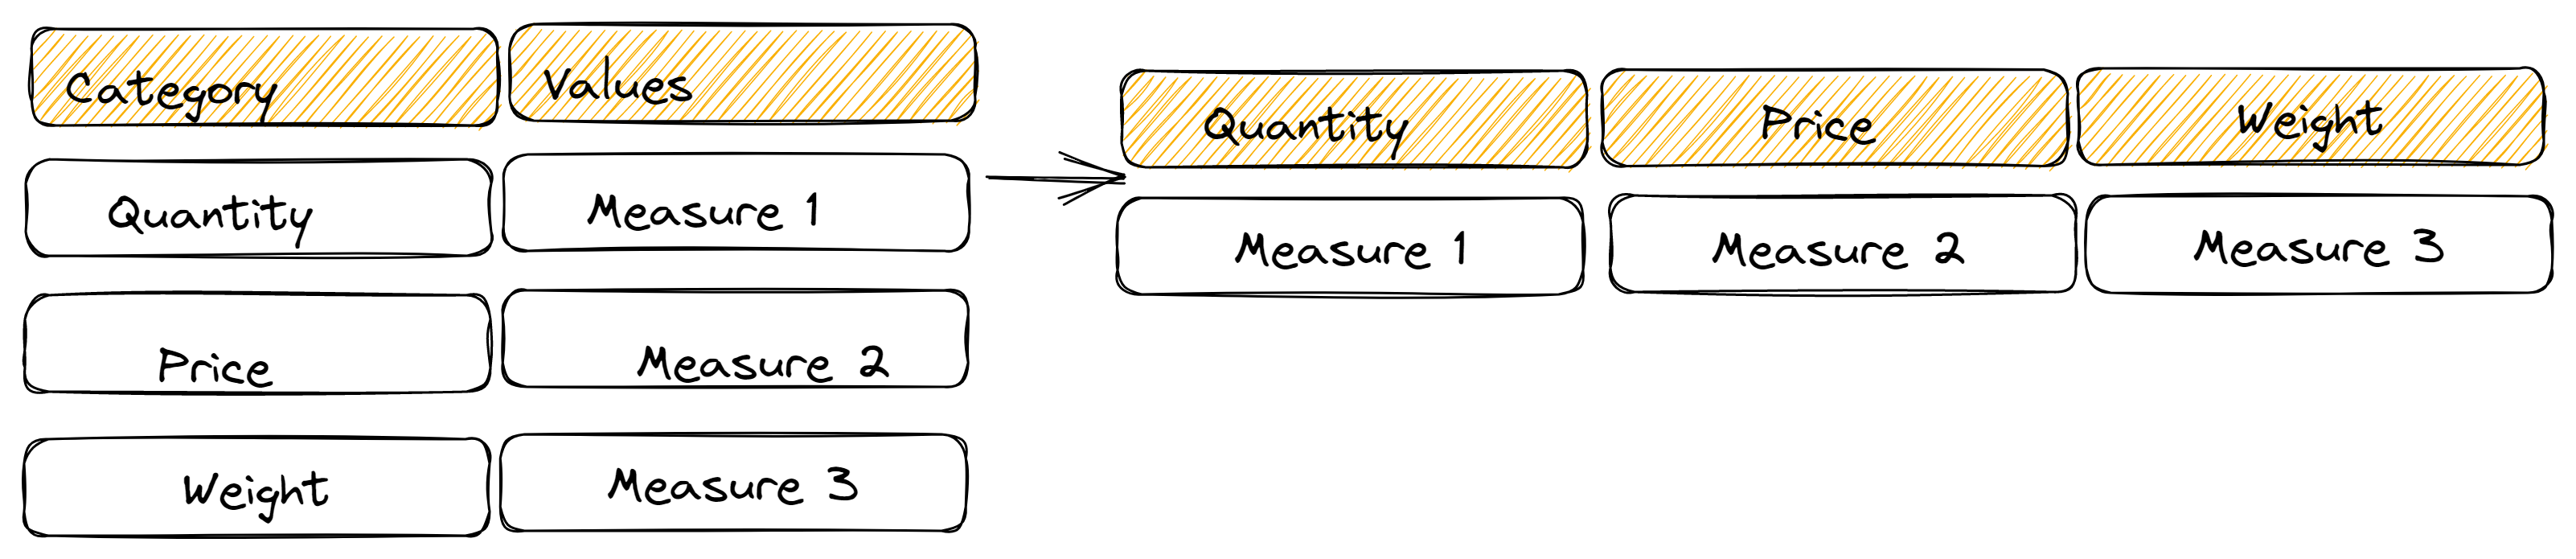
A very basic definition of pivoting data is taking rows and making them into their own columns (and vice-versa).
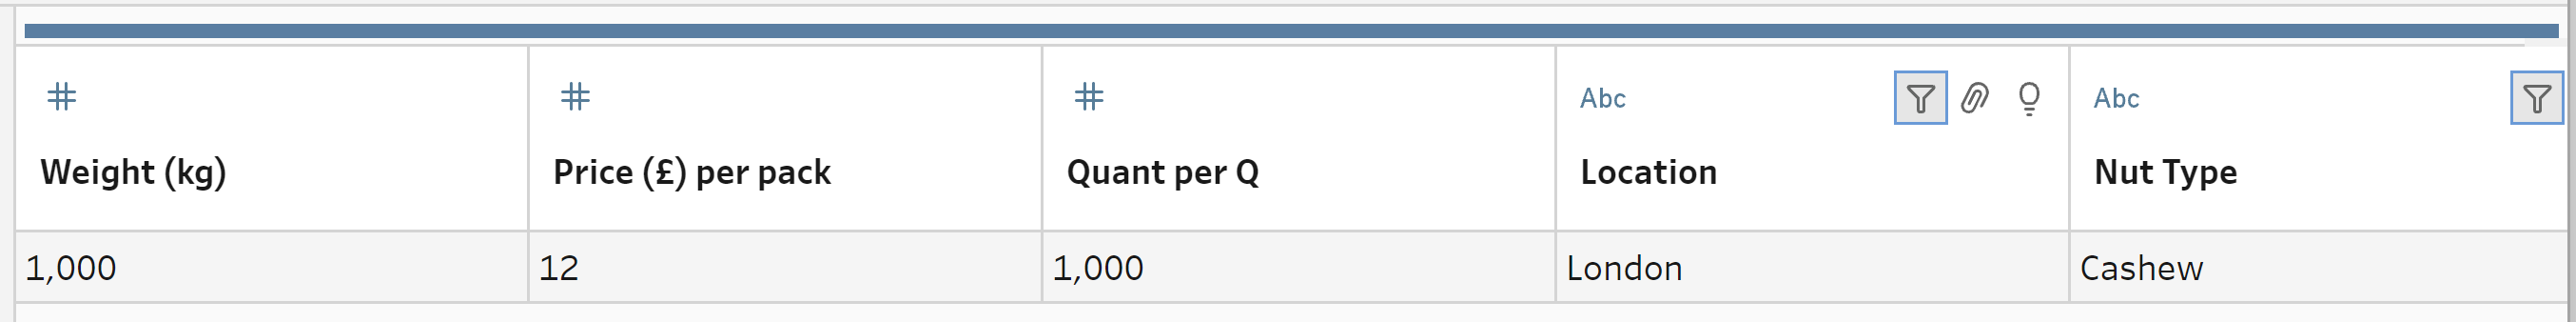
For example, take this data set:

For each London branch that sells cashew nuts we have an individual record for each category (weight, quantity sold and price). Ideally, we would like to only have one record (row) that shows all of this information. To do this, we want to do a row to column pivot. This will take each individual category and make them into their own field names.
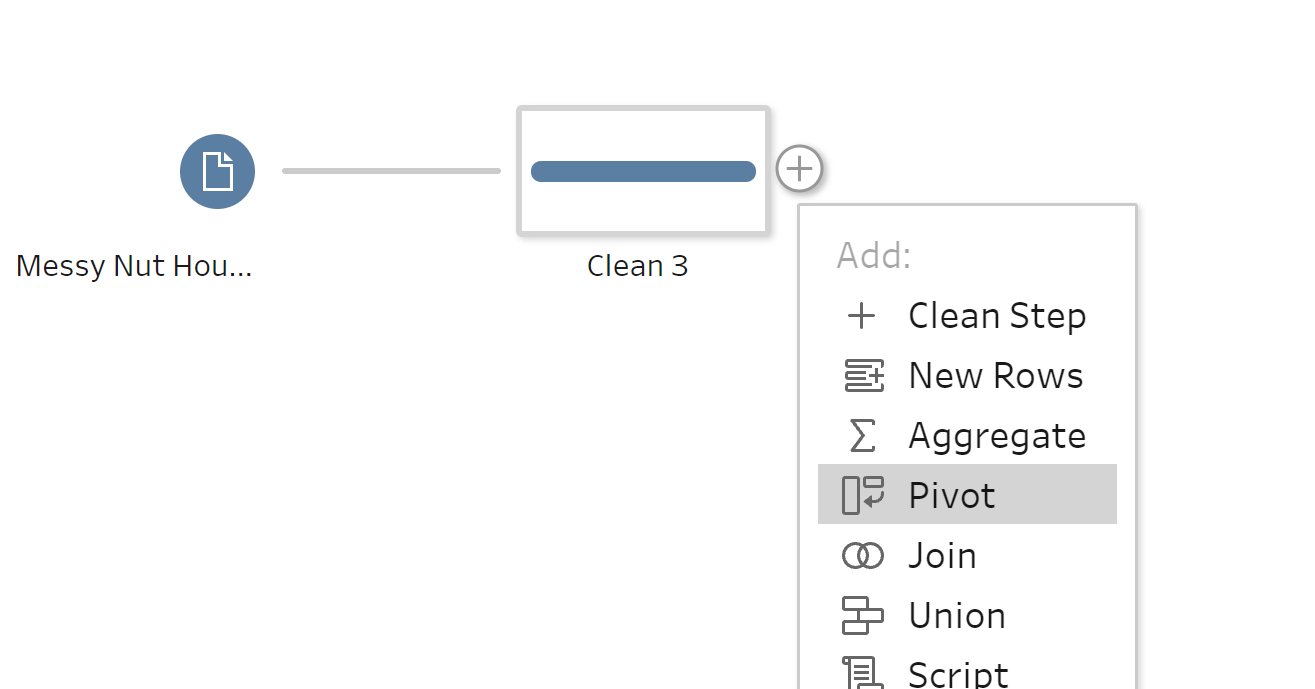
To do this in Tableau Prep, you need to add a Pivot step.
This will open the following view:
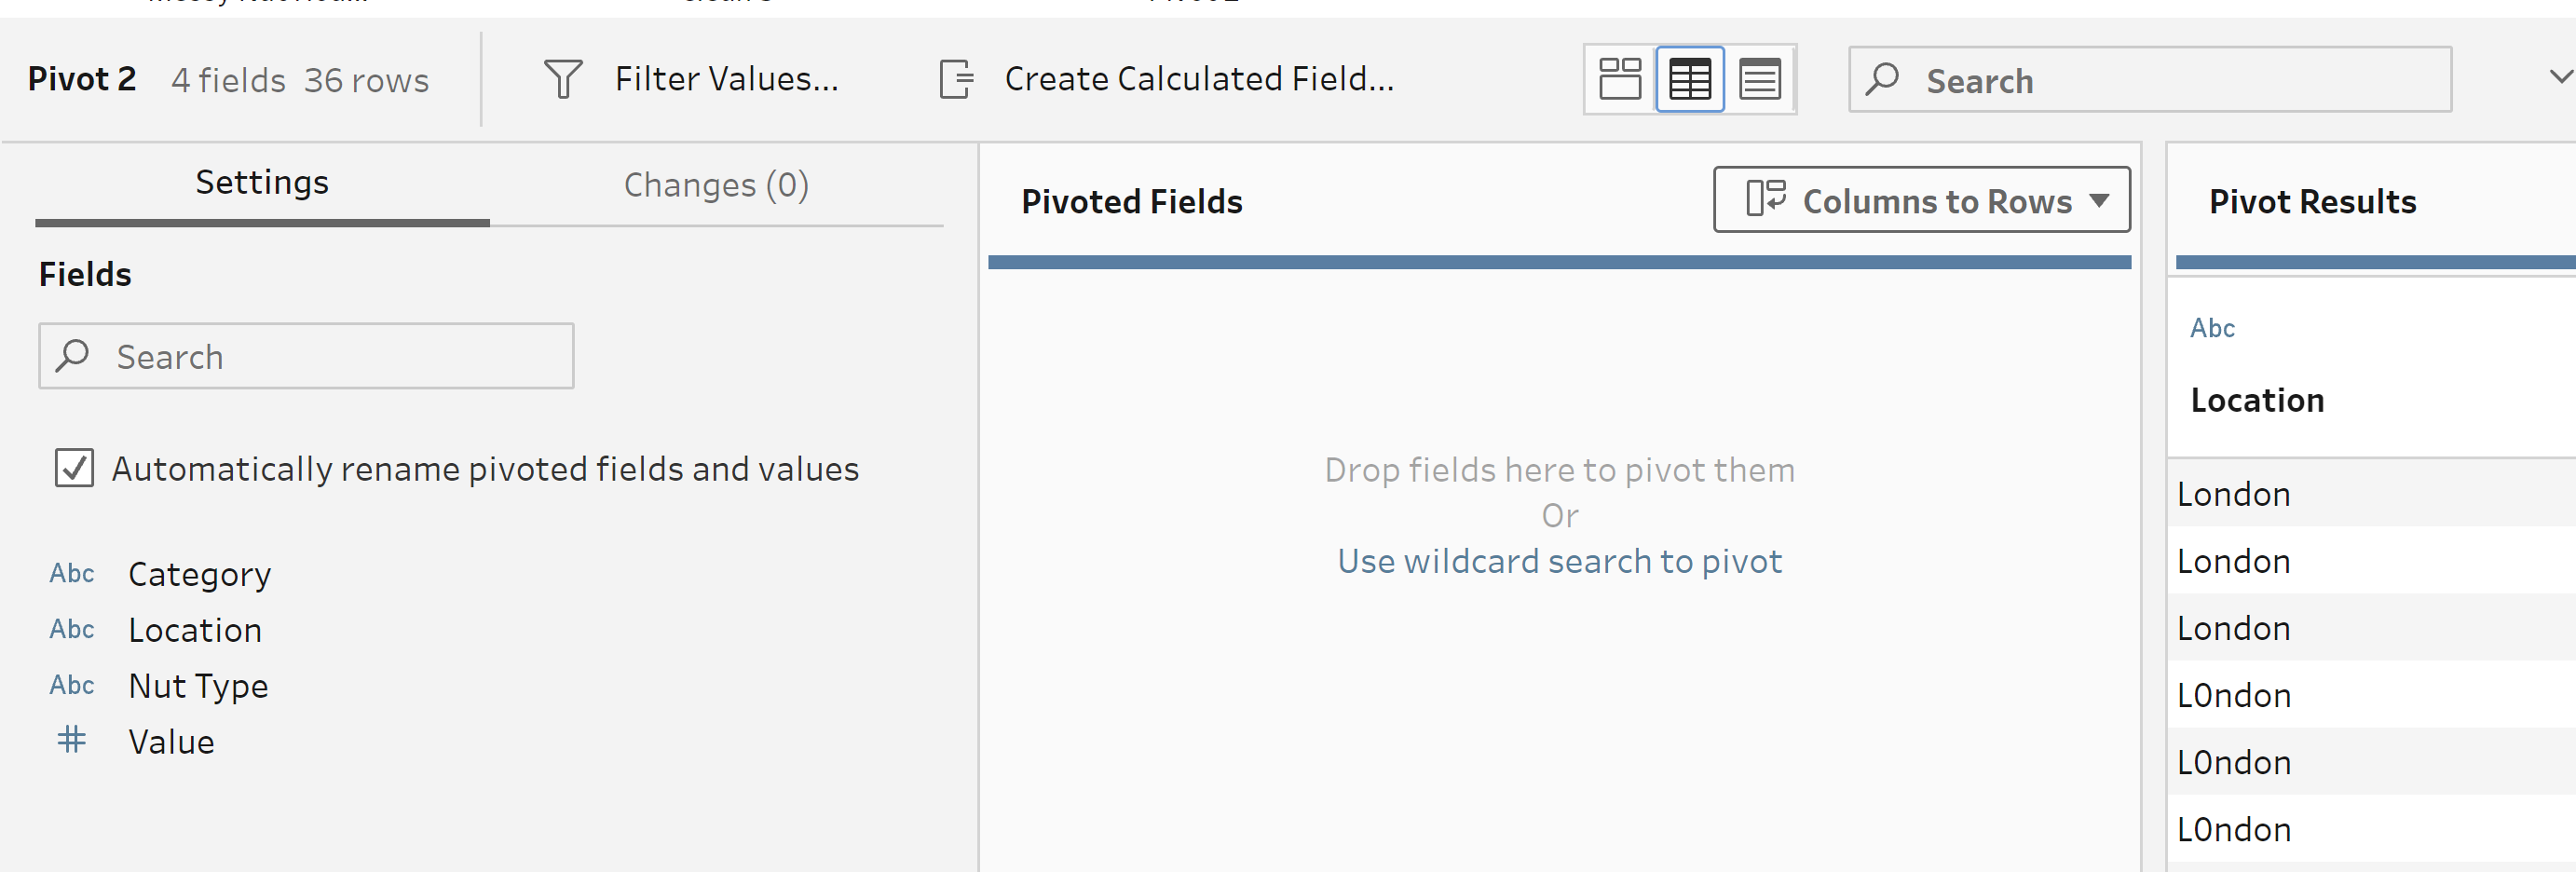
We need to change our pivot orientation to rows to columns as we are taking values from each row and making them into their own columns, leaving us with this view:
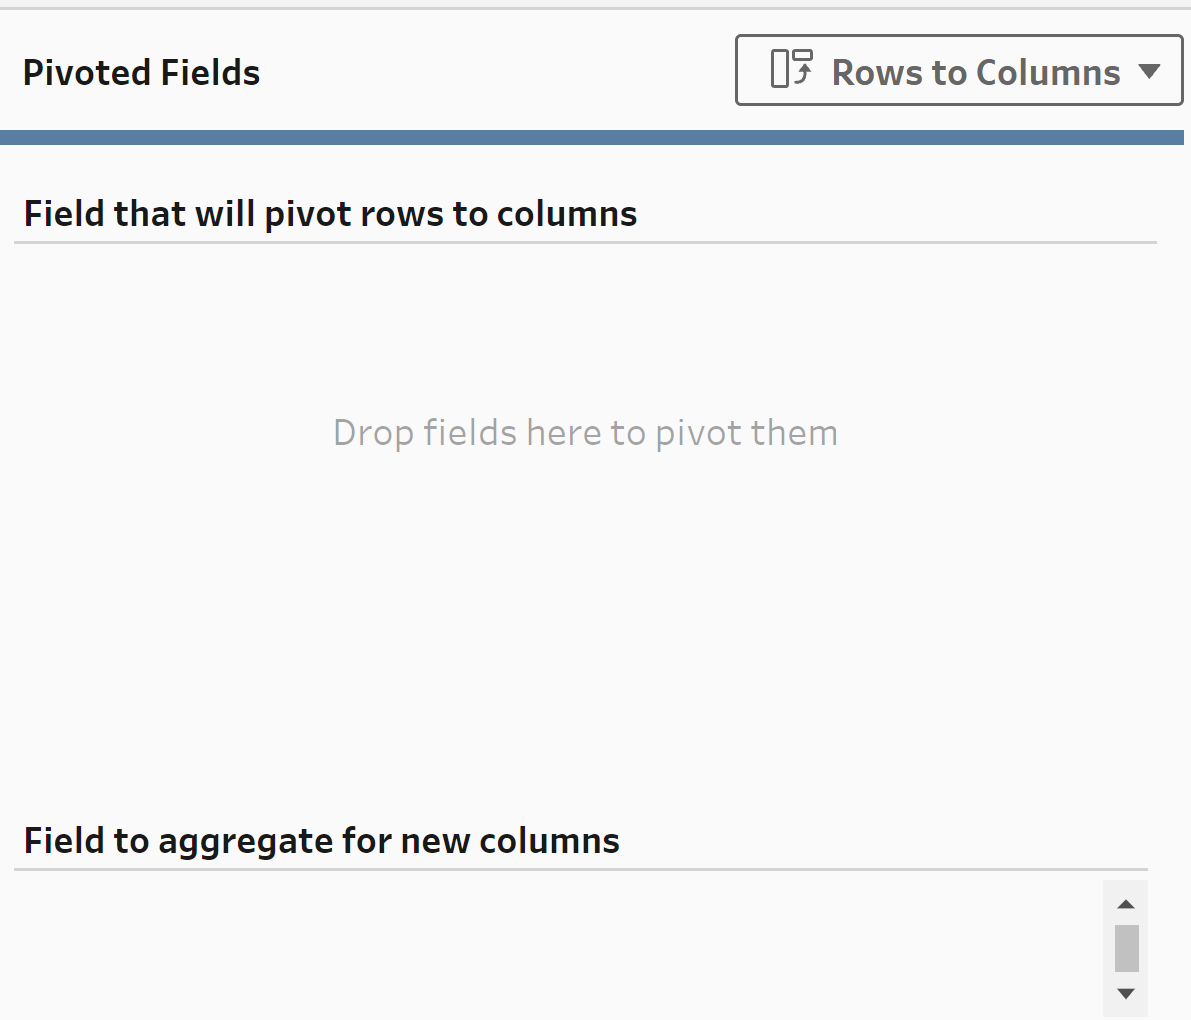
Drag categories to the 'Field that will pivot rows to columns' and values to 'Field to aggregate for new columns'.
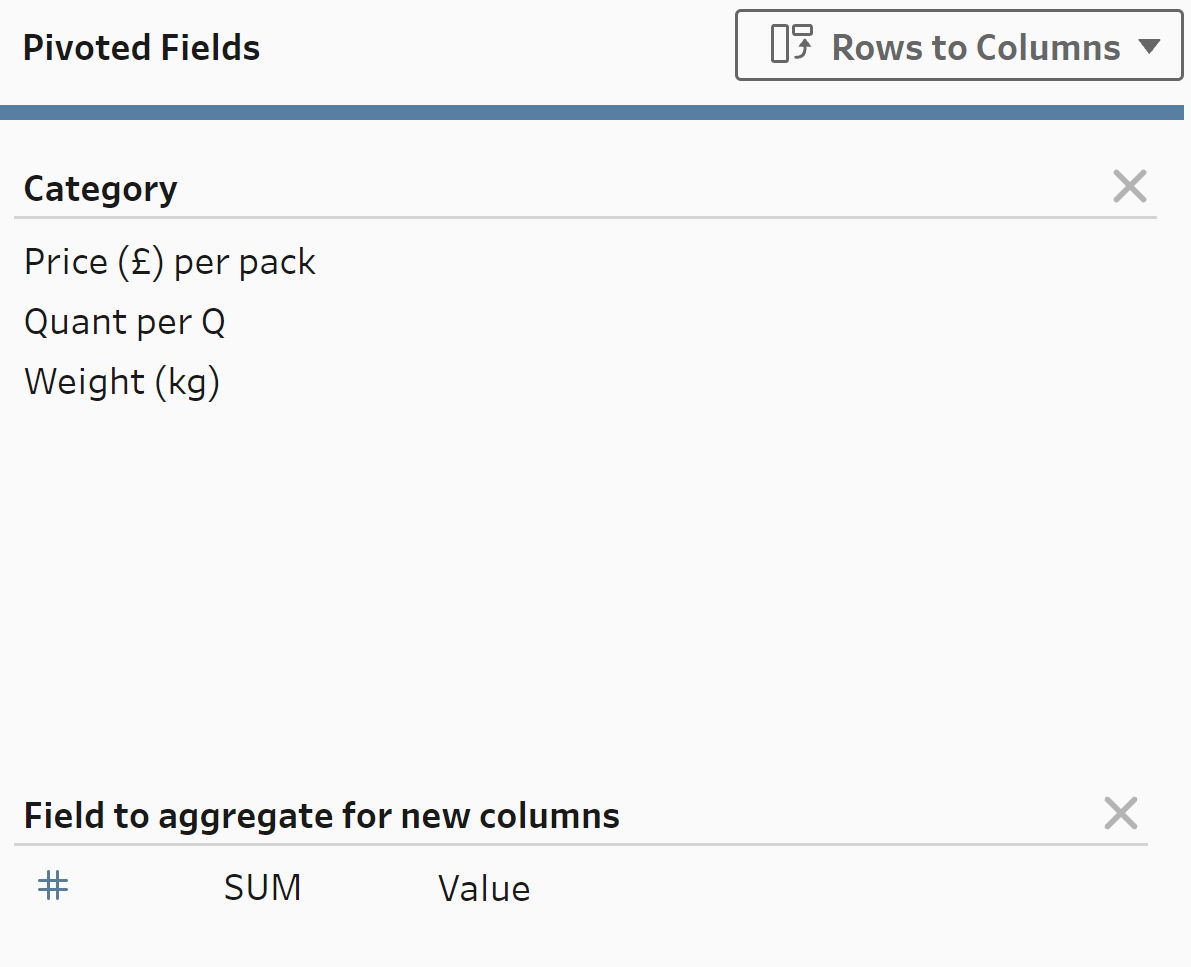
The type of aggregation in this case doesn't matter, as there is only one value for each category. However, you may wish to change this if there are more values for each thing.
And there we have it: