


For Day 2 of Dashboard Week, DS44 was assigned a task that required combining planning, SQL & Power BI skills to create a LEGO themed report. We had to scope and plan a dashboard based on a Snowflake schema, we then had to query the data we required to build a report on Power BI.
I began by sketching out by doing some data discovery to understand the available data. I created the below schema to help me understand each table and how they each relate to one another.
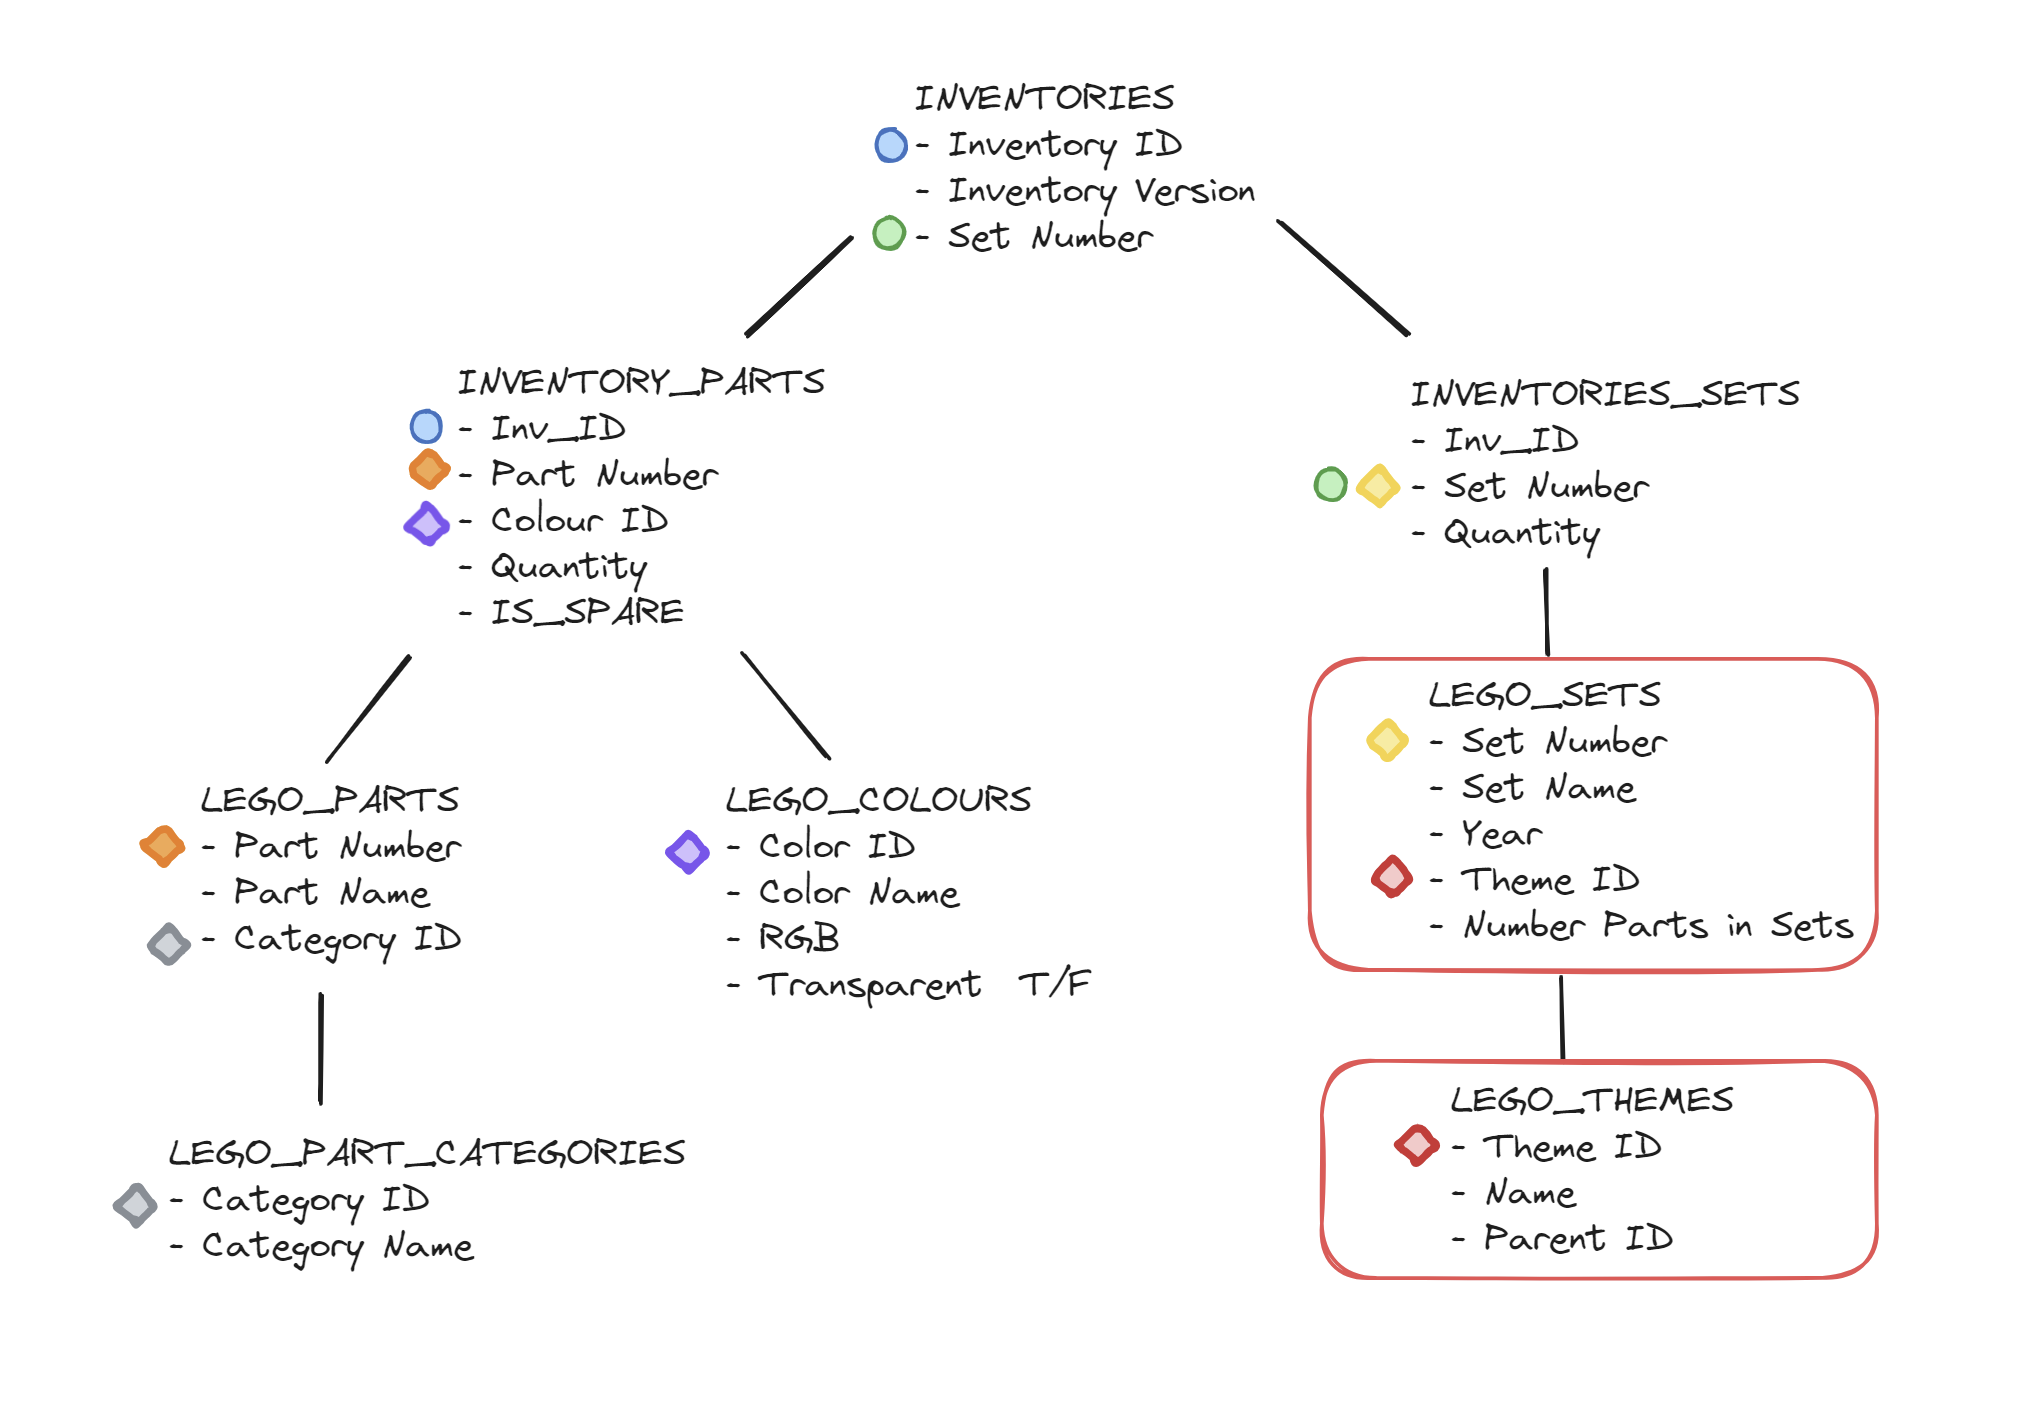
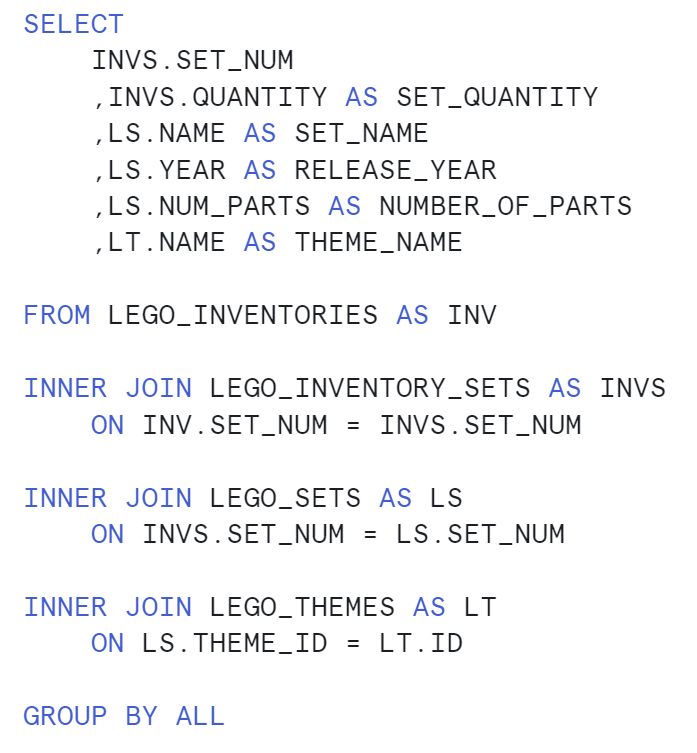
After some brainstorming and some scoping I made the decision to create a report exploring the data through the lens of Lego sets and themes. For this I mainly required the two tables outlined in red on the schema above. To pull this from Snowflake I wrote the following SQL query:
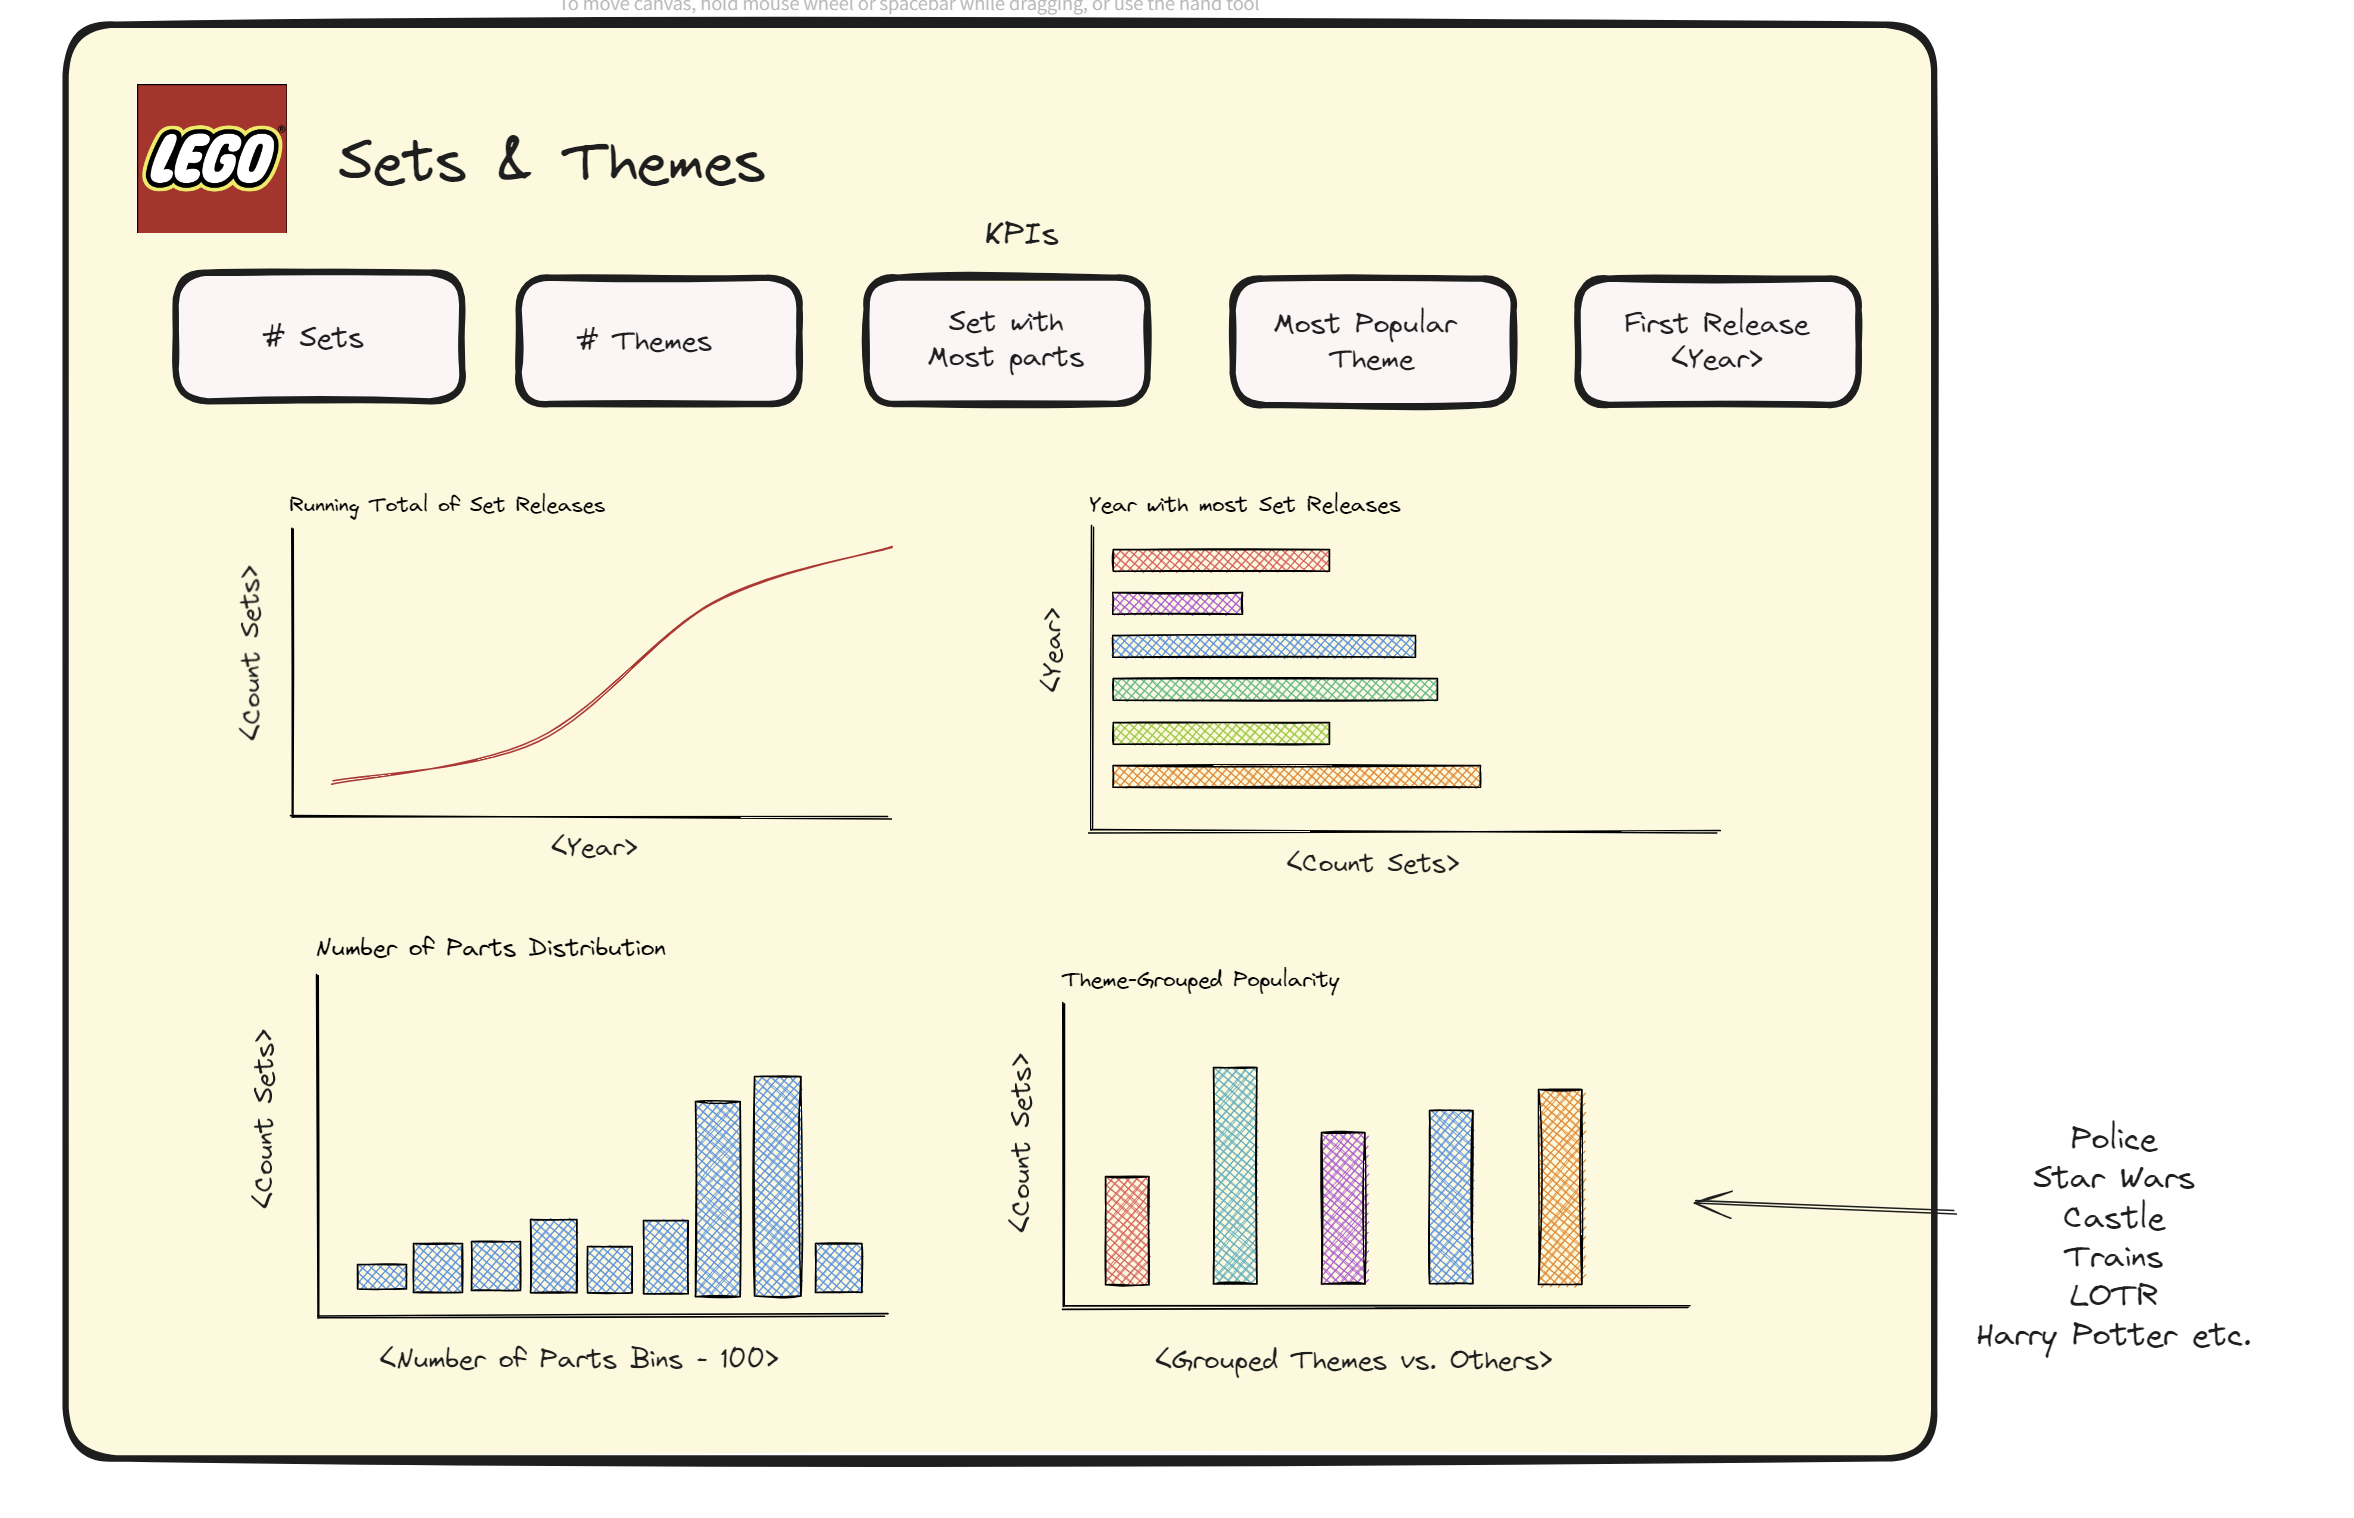
Having my data in order, I then began to sketch what my report would look like. I ended up with the following sketch.
The sets and theme data was limited with only 6 fields and 2,321 rows but I was happy with my ideas and felt like I could execute them in the allotted time. The below screenshot is of the final report:
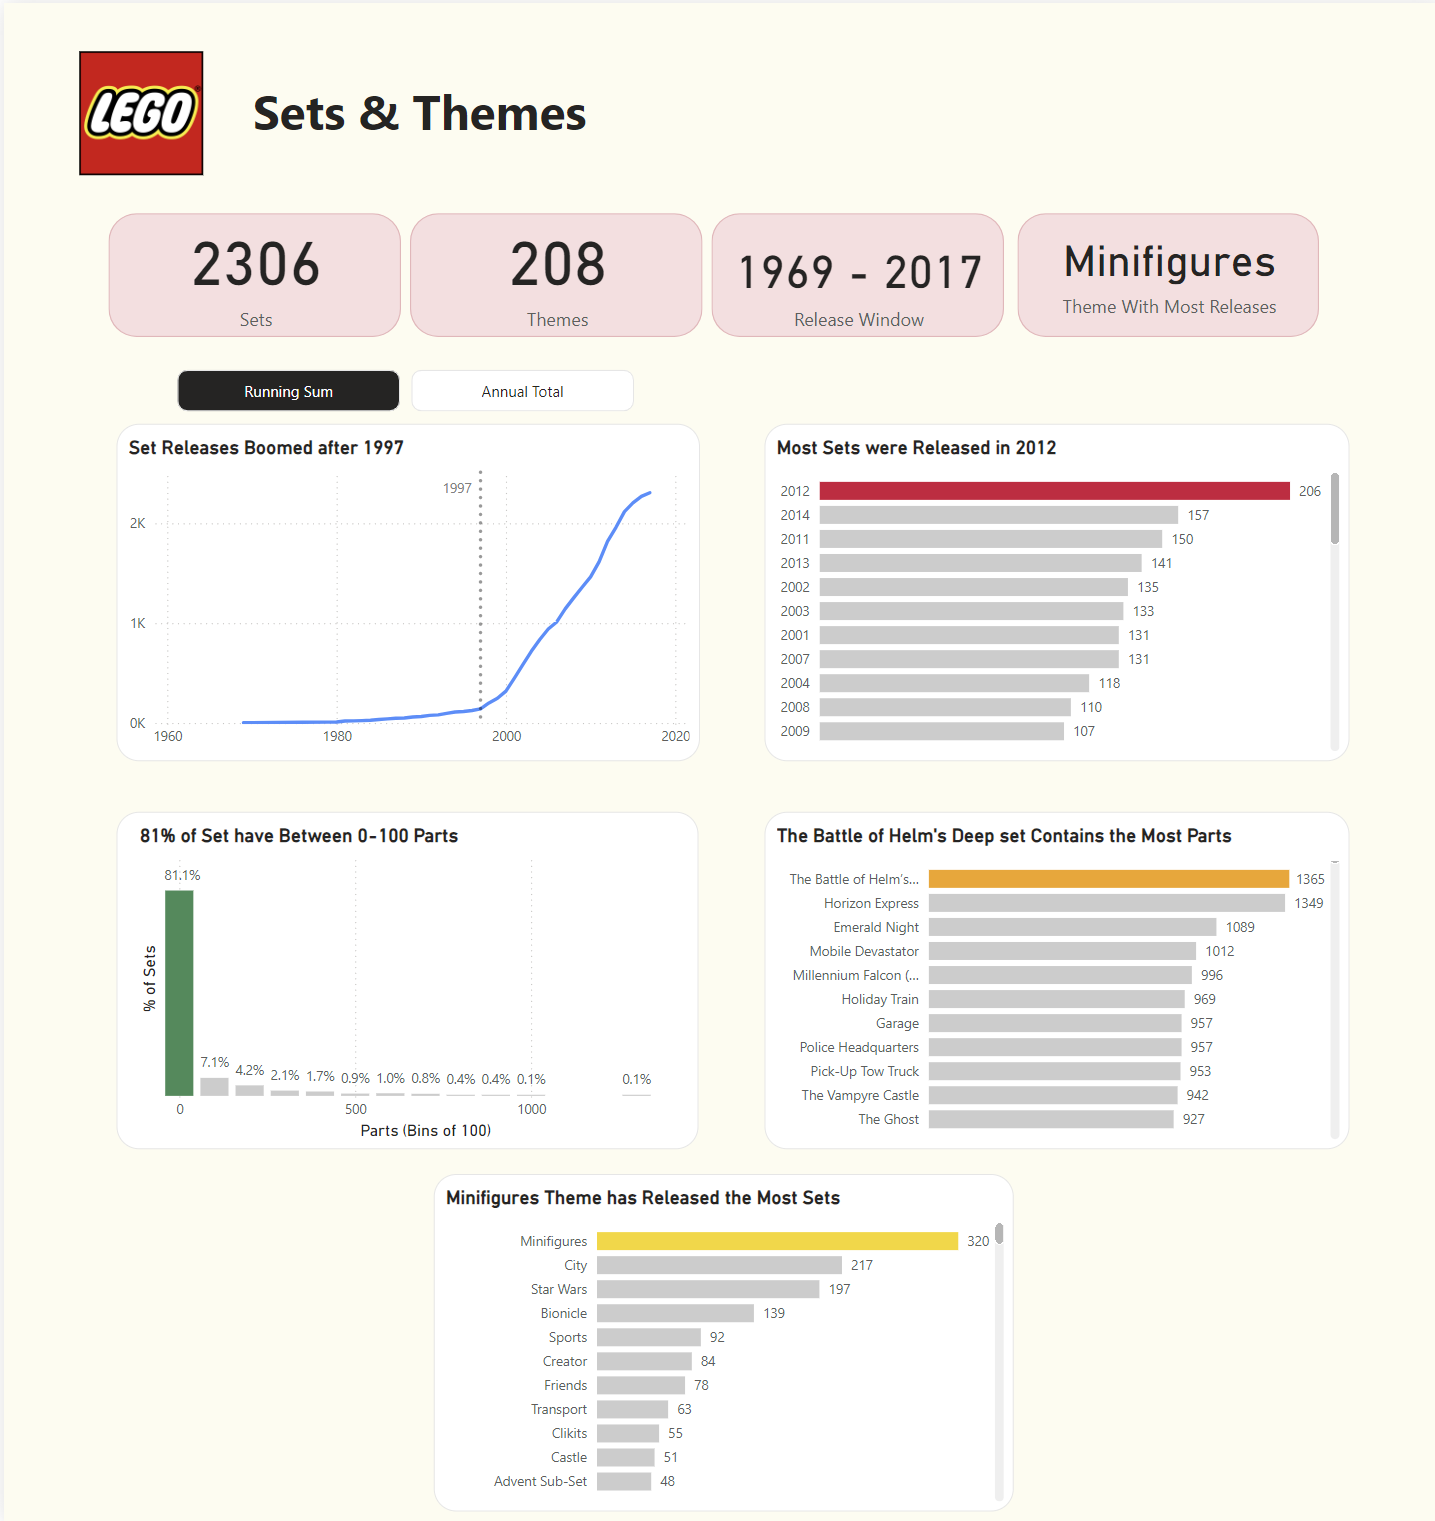
Overall, I was happy with my work for the day. While I believe that the report lacks a deep level of analysis, I was successful in scoping and planning appropriately to have a polished report. I very much enjoyed working with the data and look forward to the rest of dashboard week!