


Intro
Today, DS44 kicked of Dashboard Week. In the morning, we had a lesson around accessibility in Tableau. This covered the different types of design and use cases for how you can design for people with different impairments, neurodivergences. After lunchtime, we were tasked with building a dashboard based on an assigned scenario.
Brief
I was responsible for designing a screen-reader compatible operations dashboard for an executive. The data provided related to Prescriptions made in the south-west of England. A screen-reader is used by people with impaired vision. It takes information from the Document Object Model (DOM) of a webpage and verbalizes it for the user. Popular examples of this are JAWS and Microsoft Narrator. For this project, I used Narrator.
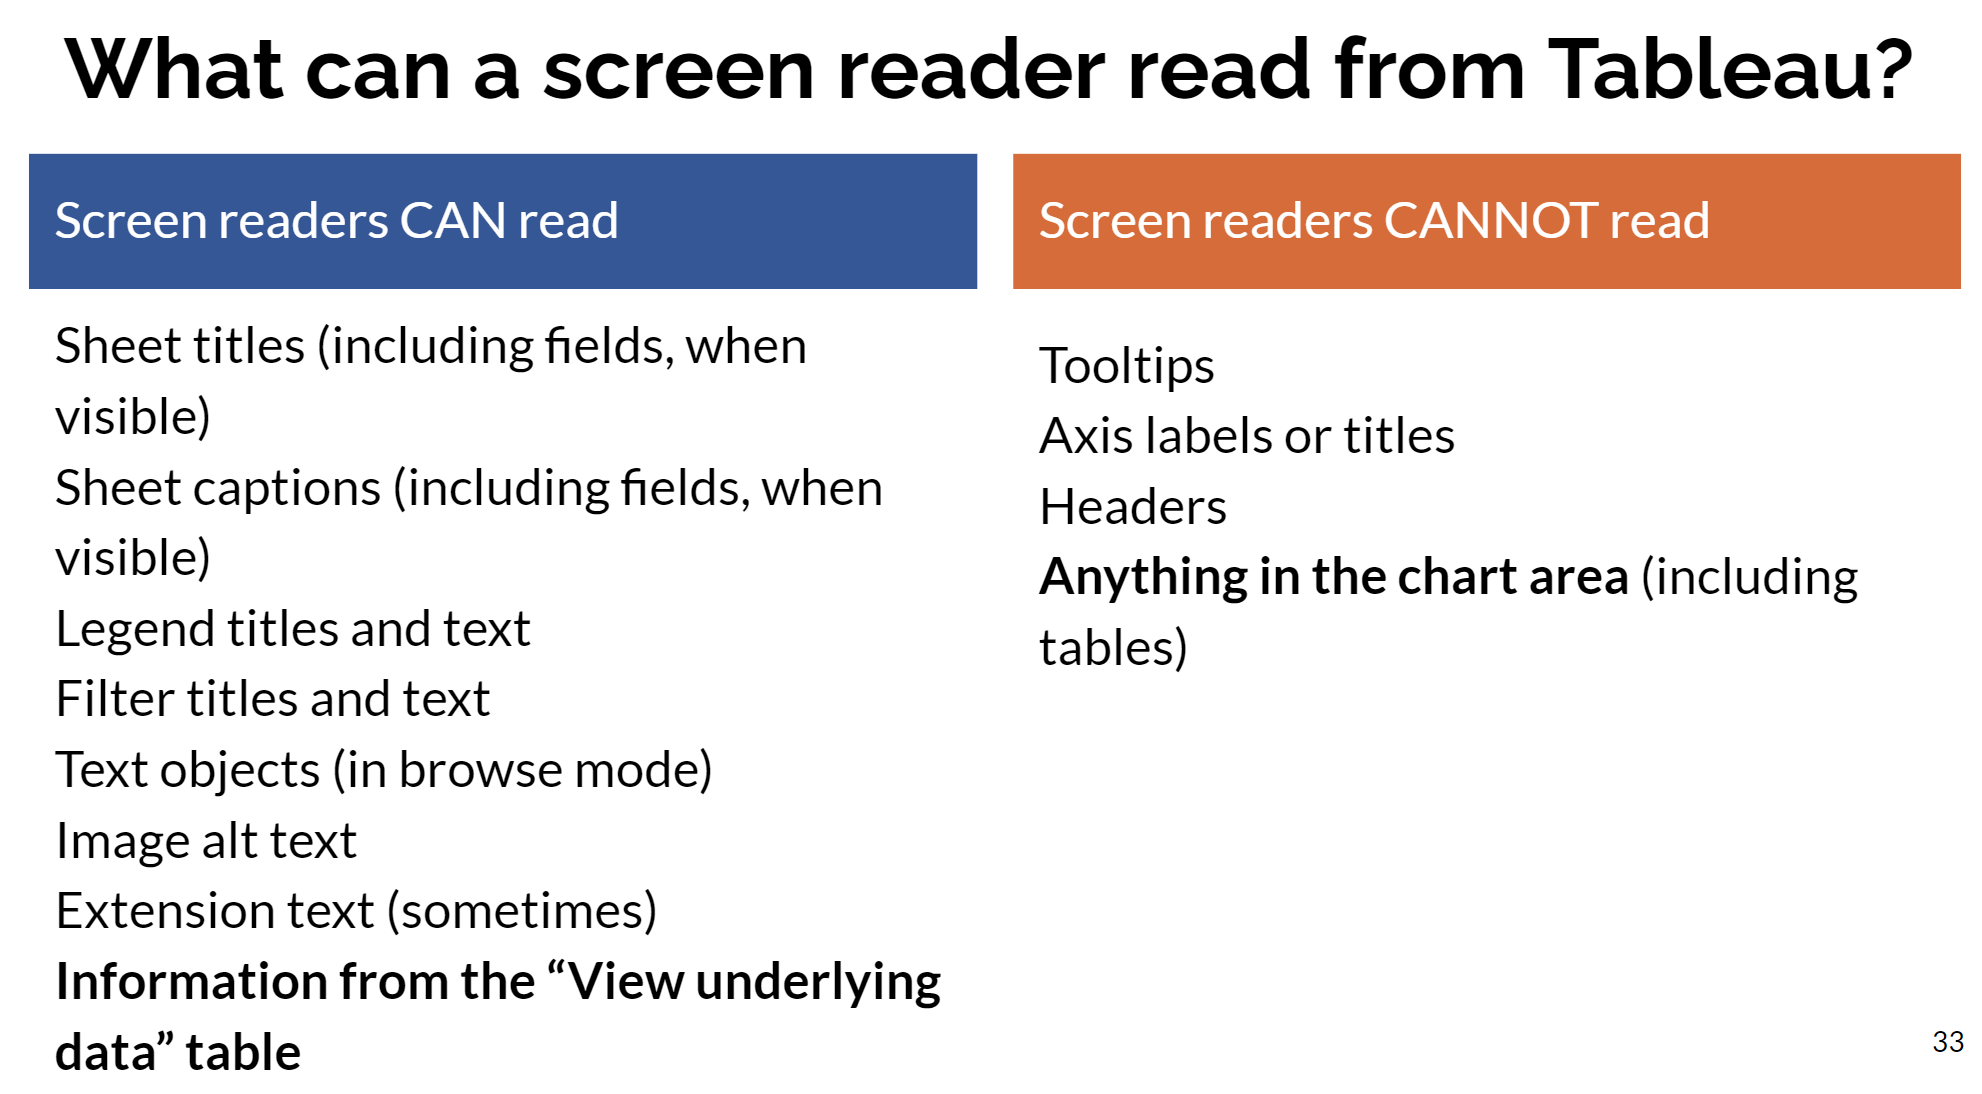
Tableau supports screen-readers to a certain degree. The capabilities are below:
Dashboard
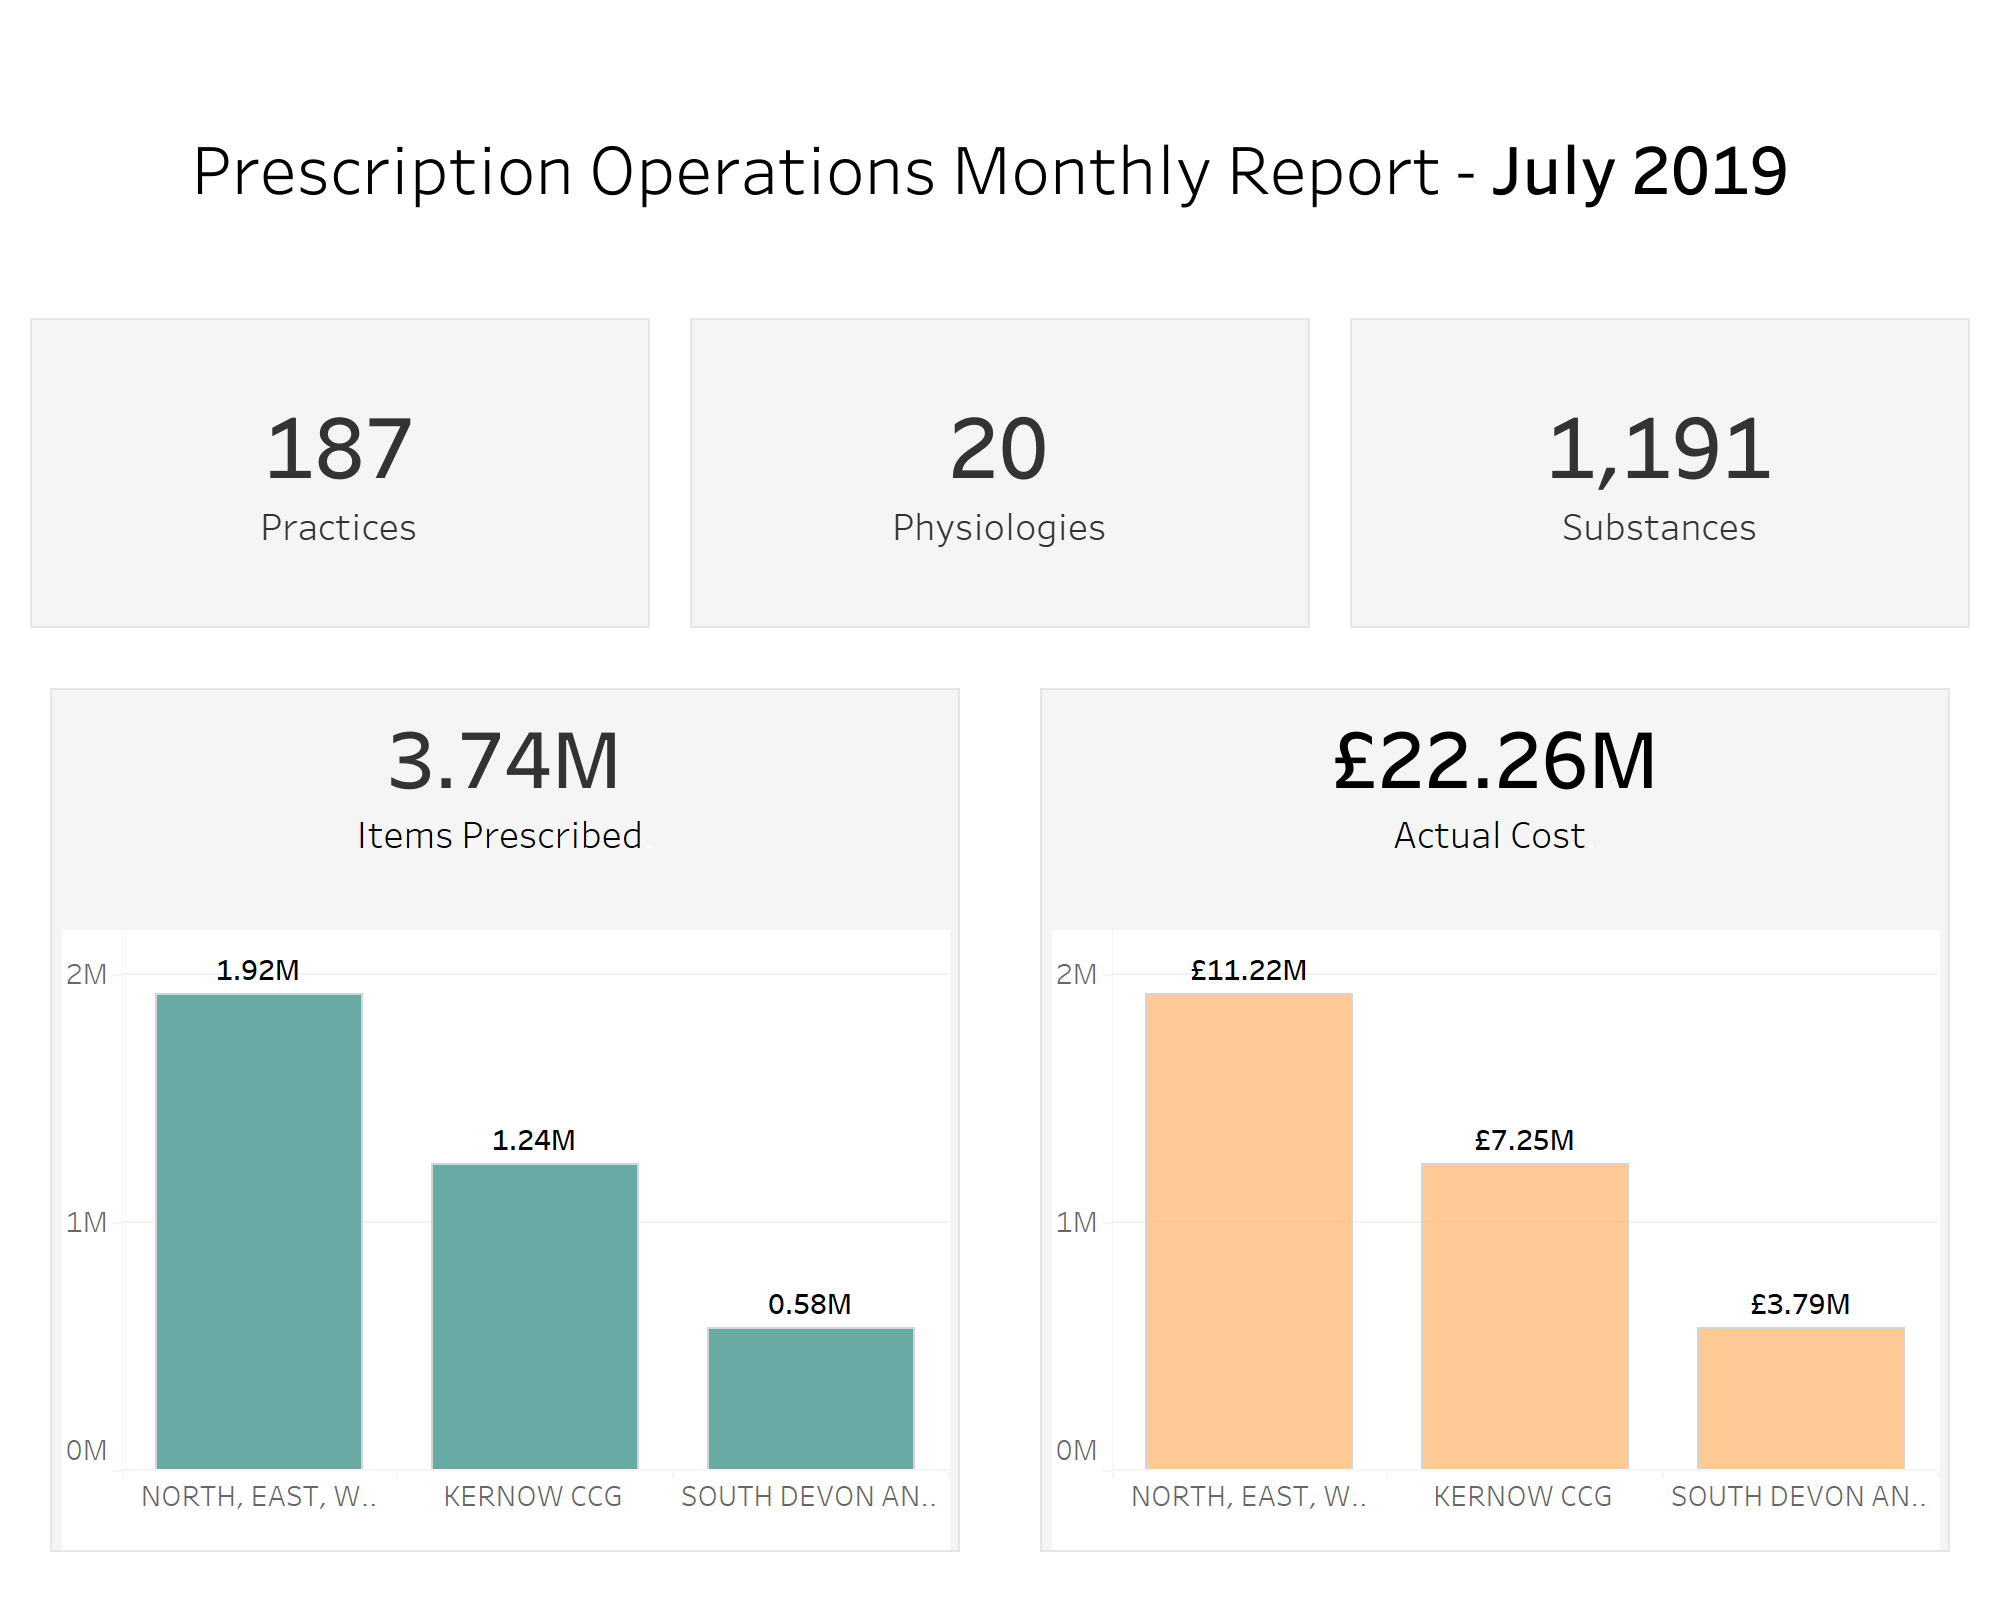
Taking the consideration into account and with only a few hours to build, I got to work. The finished dashboard can be see below. It is a simple design but compact and screen-ready compatible.
Takeaways
My main learning from the day was how important it is to design intentionally. You can’t always build to include everyone but you can make decisions that make your dashboard as universal as possible.
On a more practical level, because screen readers can only read certain aspects of a dashboard, it is super important to hide text that describes the dashboard and what is happening in the chart. I did this by including the text in the title as size 1 in the colour of the dashboard background. It is also crucial to hide text signposting each chart so that the user can follow the progression of the chart.