In Tableau, discrete and continuous date fields represent different ways of organising and visualising date fields:
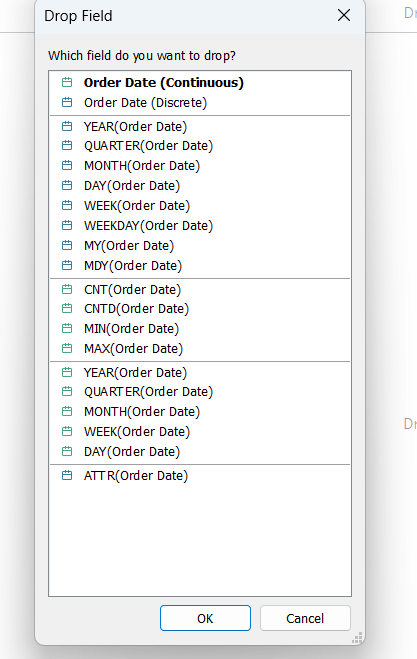
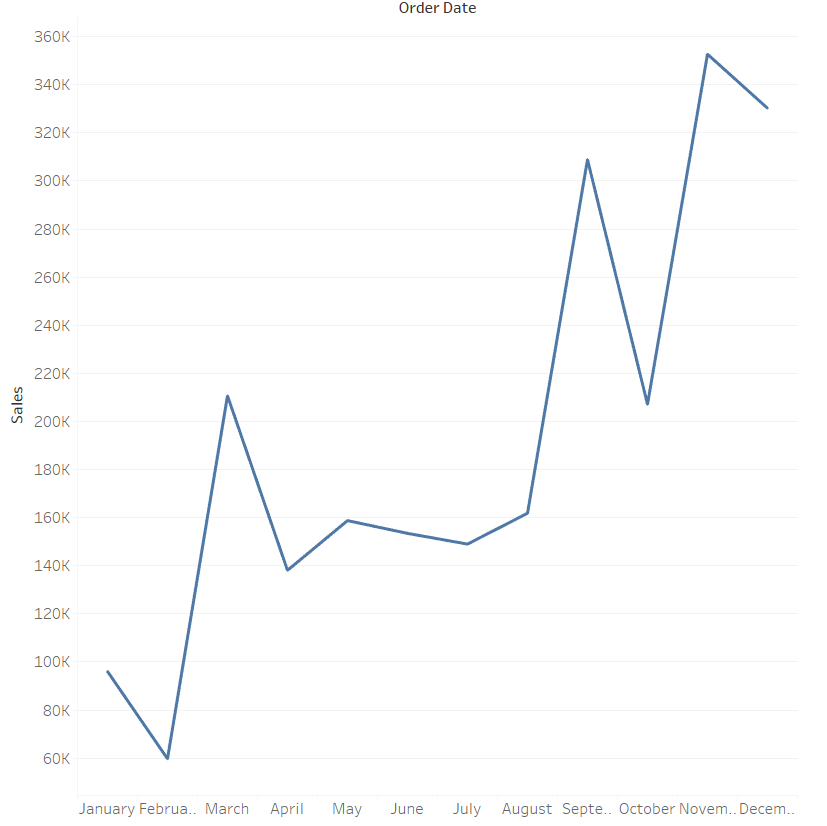
- Discrete Date Field: BLUE
- Discrete date fields are represented as separate, distinct values along the axis of a visualisation.
- They break down date values into discrete units such as years, quarters, months, or days.
- Discrete date fields are typically used when you want to analyse data at specific intervals or discrete points in time.
- Discrete date fields are displayed as headers in the view and allow you to drill down into more granular levels of detail.
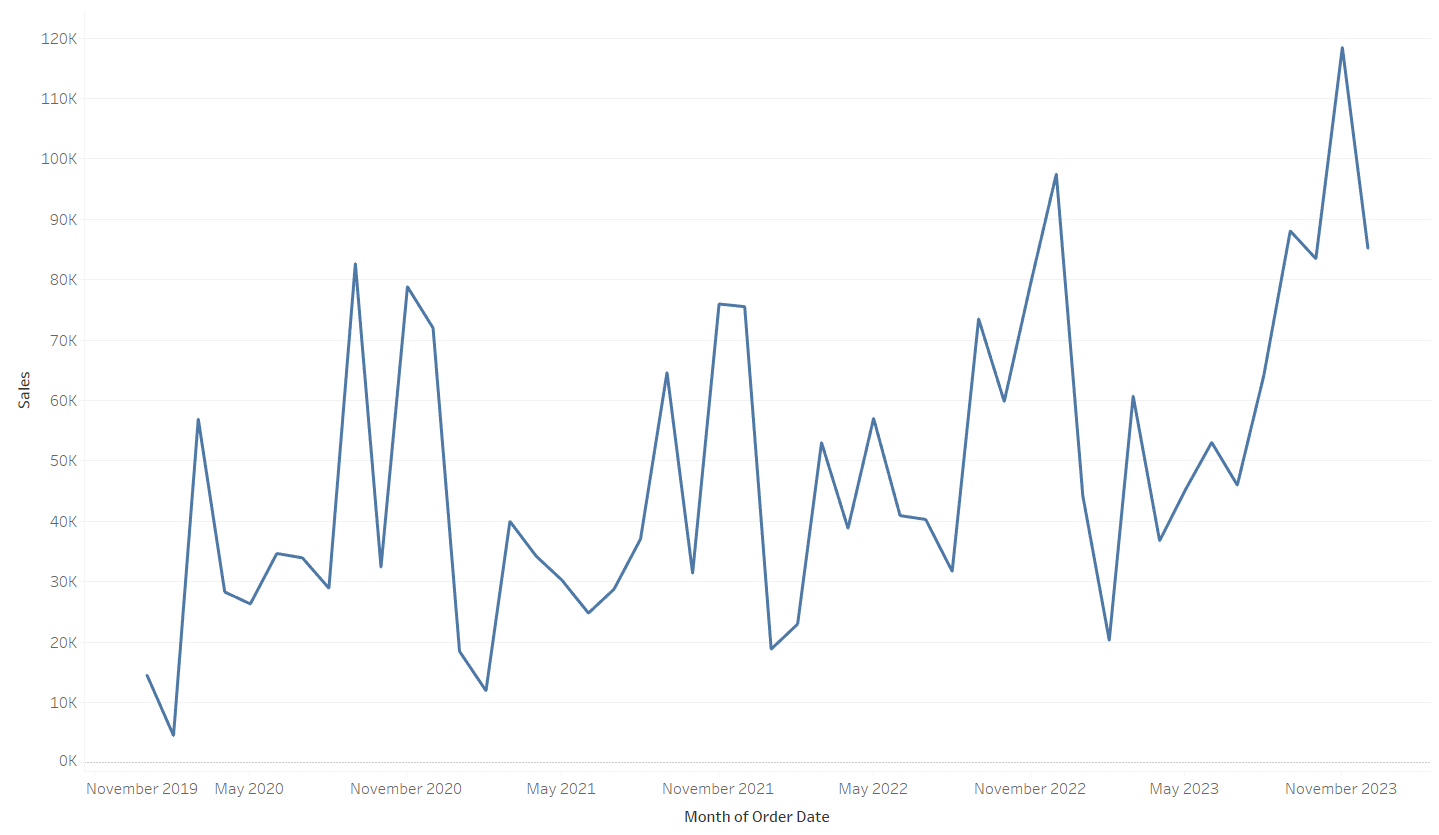
Continuous Date Field: GREEN
- Continuous date fields are represented as a continuous range along the axis of a visualisation.
- They maintain the continuous flow of time and display date values as a continuous scale.
- Continuous date fields are often used when you want to analyse data trends over time or display data across a continuous date range.
- Continuous date fields are displayed as axes in the view and allow for smooth visualisations of trends and patterns over time.