


Basic Interactivity:
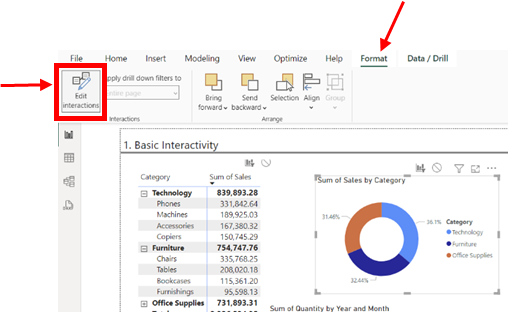
In Power BI Desktop, when selecting on a visualization you can opt for other charts to be altered depending on a specific selection. This can be achieved by selecting on format pane and allow for “Edit Interactivity”.
How to manage Interactivity:
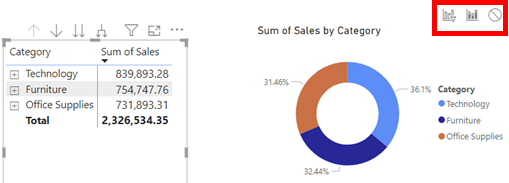
Once “Edit Interactivity” has been selected, these 3 symbols will be present.


Slicer interactivity:
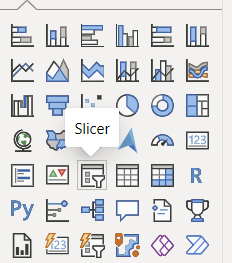
Power BI offers various types of slicers, including dropdowns, list slicers, range slicers, and date slicers. The type of slicer you choose depends on the nature of the data and the user experience you want to provide!