In this blog I will outline the ways in which I used ChatGPT to help me generate synthetic data. One of the reasons I wanted to blog about this was because synthetic data can be really valuable to a business. If you are wanting to do some analysis but don't have access to the data but know what the fields will be then you can mock some data up and start figuring out how you would like to cleanse, analyse, visualise, etc. and get started on the project without being held up waiting for data.
The task was to create a full schema of synthetic data for a fictional Airline based in the future. The aim of the project was to create a full data set that could be used for training future data schoolers. The brief was open to use any tools necessary to make a data set as realistic as possible. The more realistic the data set the more useful it would be when used for training.
Given the lack of restriction on the tool to use I wanted to see how good ChatGPT would be at producing synthetic data. Before getting started with generating the data, I thought it would be important to outline the overall story line of the Airline and then also some more specific trends that I was looking to have built into the dataset.
I am very glad that I spent the time to plan the schema and the trends that I wanted in the data because it meant that I was not redoing work later on after changing my mind. Also a key benefit of working this way is that you can tell ChatGPT the trends you want. I found that giving vague prompts will result in you not getting the trends you would like. After some iterations of prompts I found that doing the following steps gave me the best results in ChatGPT:
- Start by outlining the nature of the data set, for my example of an Airline I began by explaining when the company started, how many planes we were flying, between which airports, how many staff, etc.
- Make ChatGPT write code for python (You can then run the code using Jupyter Lite workbooks). This step is especially useful for when you want over a 1,000 rows of data.
- Explain what you would like each row of data to represent.
- Clearly outline what each field in the data is and the format you want it in. For Example; "The Customer_ID field is a unique identifier that should only be 5 digits long"
- When putting in trends be as specific as possible. For example; "In the first two year of the Airline flying I would like for the number of complaints to increase to a peak. Then for the following year it should fall to a new low. Then the number of complaints should begin to slowly increase in the years following the lowest point."
I initially started by just using the CSV that ChatGPT would generate, however quickly found that when you start to ask for thousands of rows then it would struggle to do so and become time consuming. Hence resulted in asking for python code to use in Jupyter Lite workbooks. Another benefit of this method is that I could adjust the code to further tailer the generate data to match the trends I was looking for.
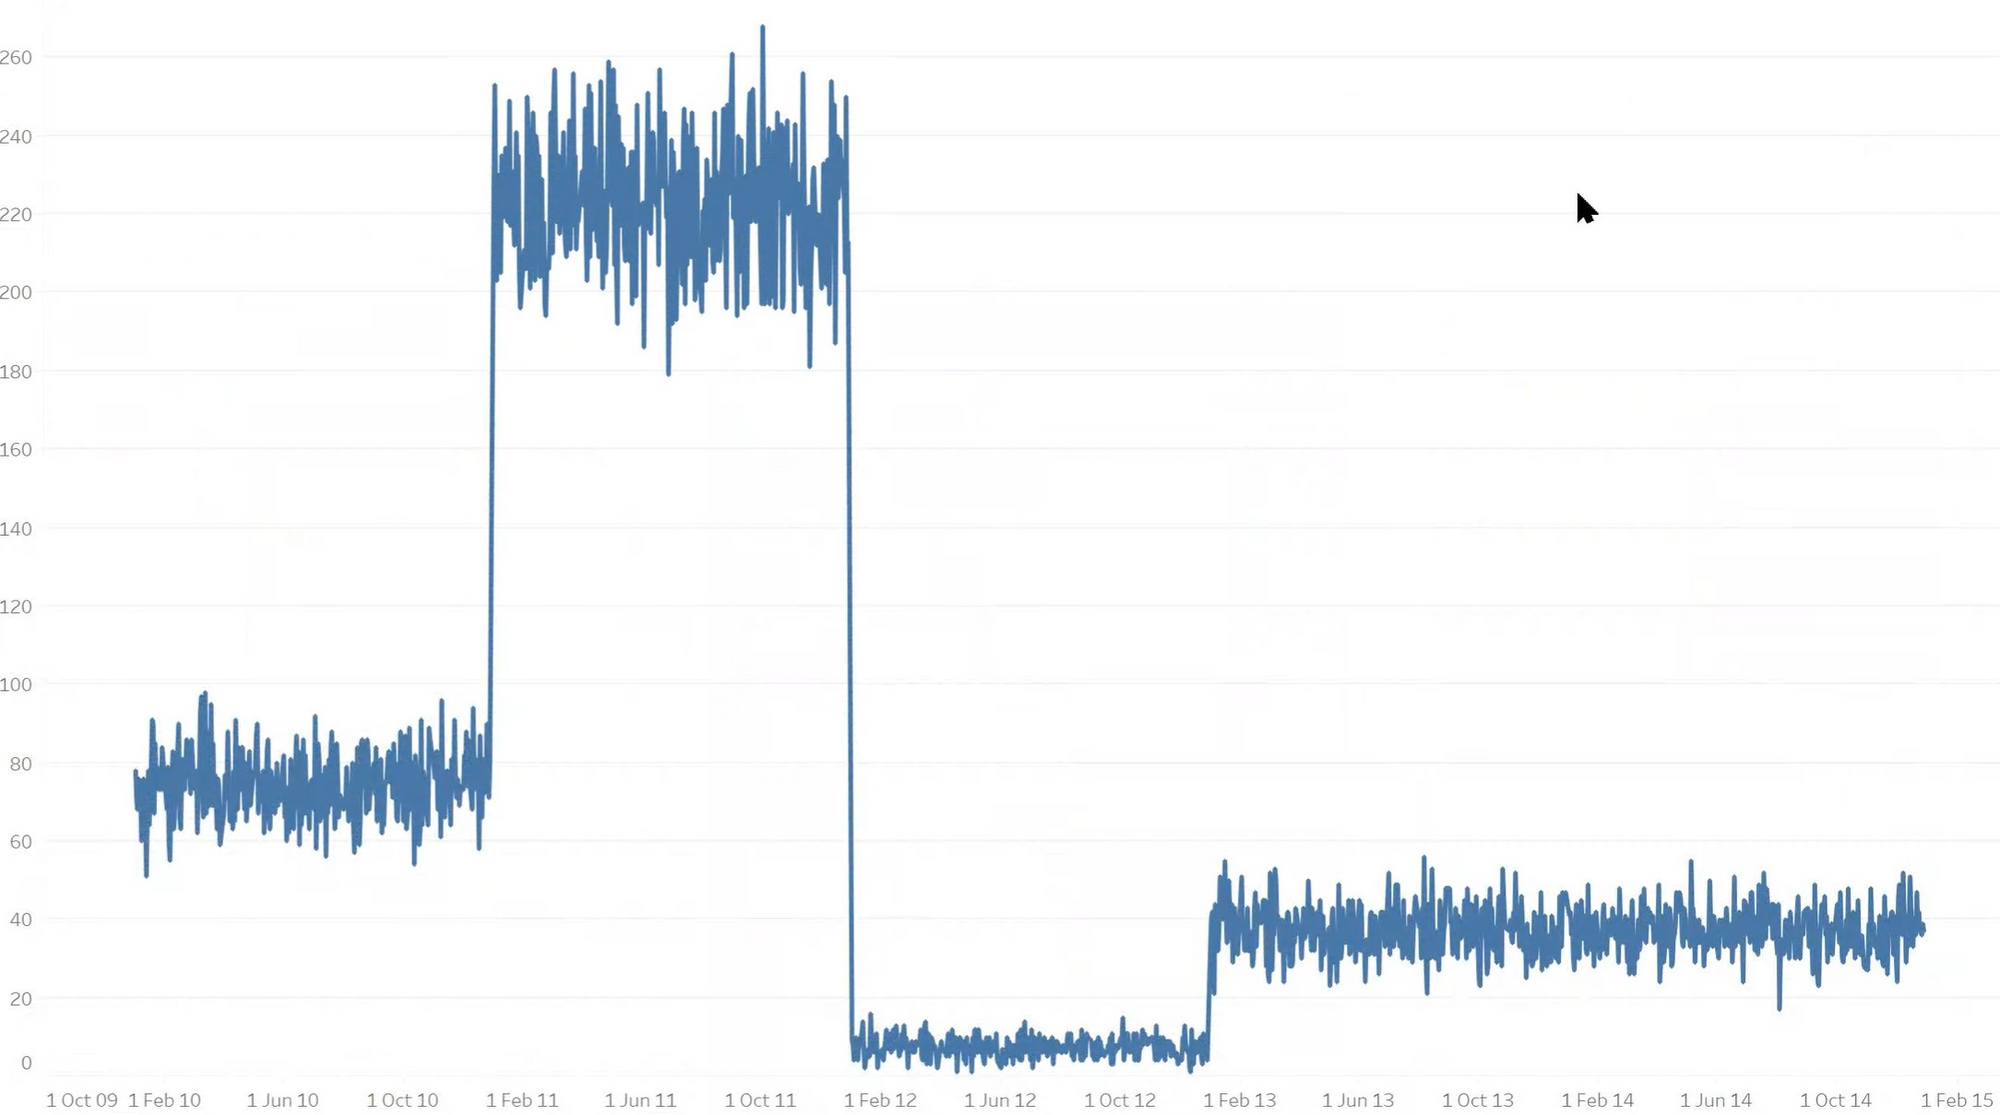
Despite following the steps above and giving a very detailed prompt to ChatGPT. The best I could get it to generate was the line chart below which shows the number of complaints over time.

I was fairly disappointed with what had been produced. The sharp steps in the data are unrealistic trends and it just generally felt unrealistic. I knew that I wanted to smooth the number of complaints between the years to show a more accurate representation of the real world.
So I went back to ChatGPT and Python codes. However, after a lot of (too much) back and forth I was no closer to having a realistic trend in the data. So I decided to take a more manual approach and started to use Tableau Prep to make some changes. I found that using the random and dateadd functions where really useful because I could move the date of some of the complaints around so that I would have a smoother change in the number of complaints. This was relatively time consuming however I was able to make progress and the time I took at the start to plan it out meant I knew what I was aiming for.
After adjusting the data ChatGPT generated using Tableau Prep, I ended up with the graph below. Showing a far more realistic representation of how the number of complaints would change over time.

Overall ChatGPT was very useful at getting me to the point where I had thousands of rows of data with a very clear trend. However it was definitely not able to get me to the point I wanted. The combination of using ChatGPT and a more manual tool such as Tableau Prep was a perfect combination. Using Power Query, Alteryx or any other tool would be a suitable substitute for Tableau Prep.
Hopefully you are now ready to go and make some synthetic data and help get a head start on those projects that are being held up by data access road blocks!
