Today marked the second day of Dashboard Week for DS44. Our task was to use SQL on Snowflake to prepare data, followed by analysis and visualisation using Power BI.
I started by thoroughly reviewing the dataset, noting the meaning of each row of data. Then, I created a story to determine which datasets and fields were necessary. After examining the data again, I sketched out my desired output. This process was more time-consuming than anticipated due to duplicate field names across different tables that represented different data.
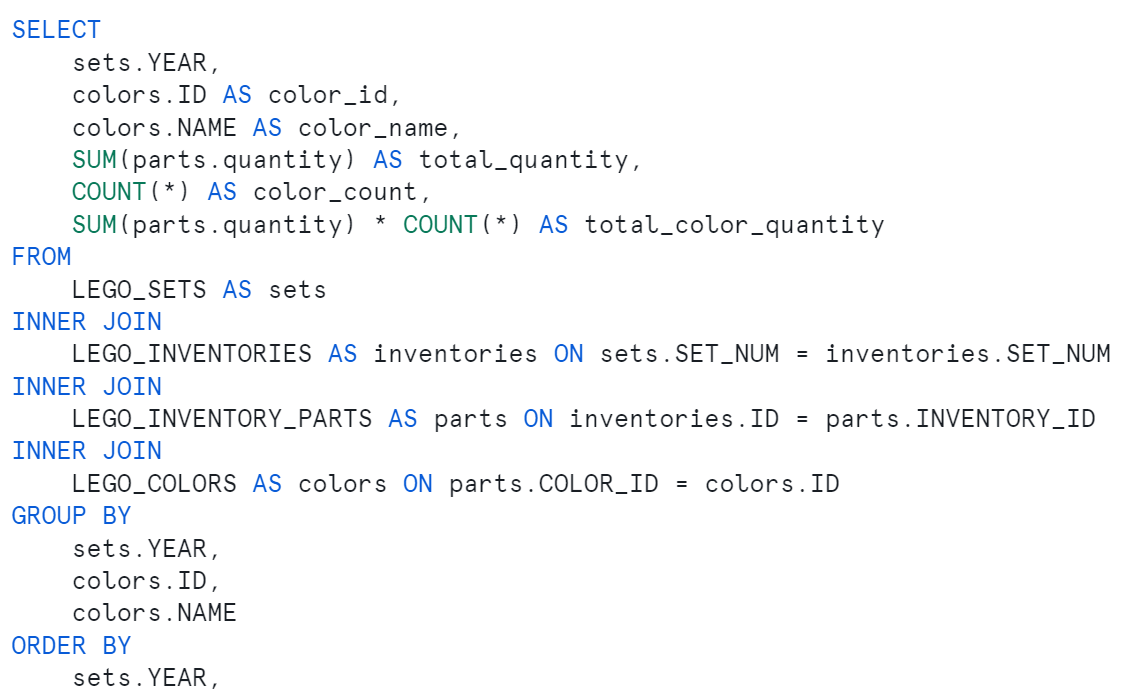
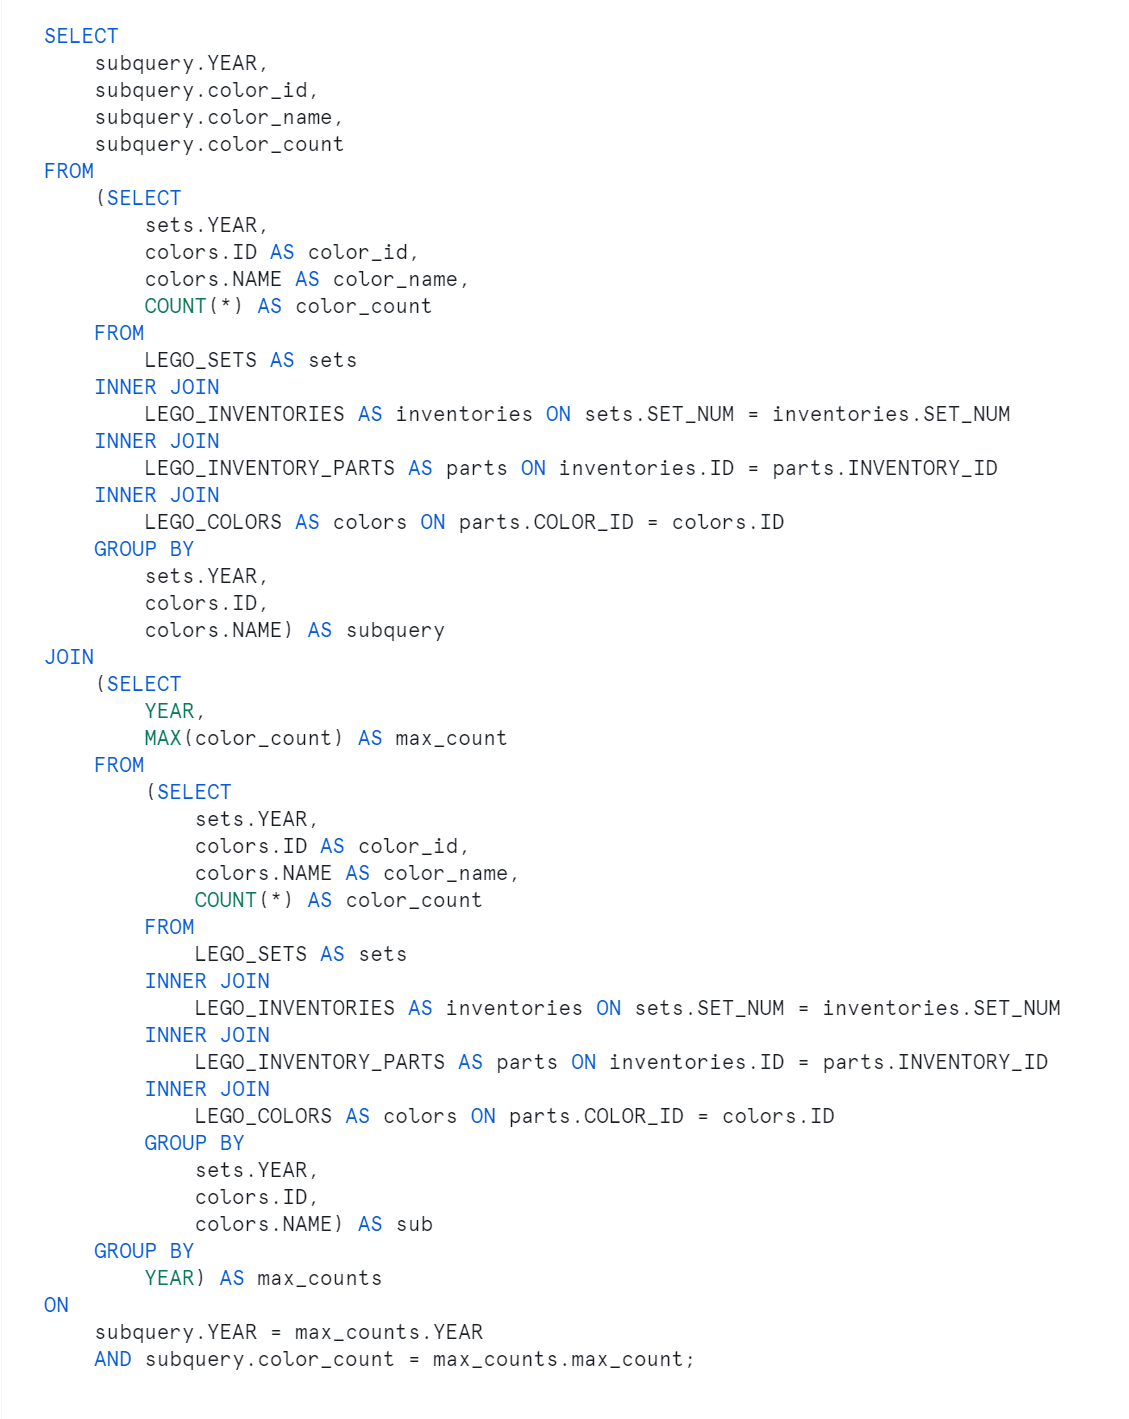
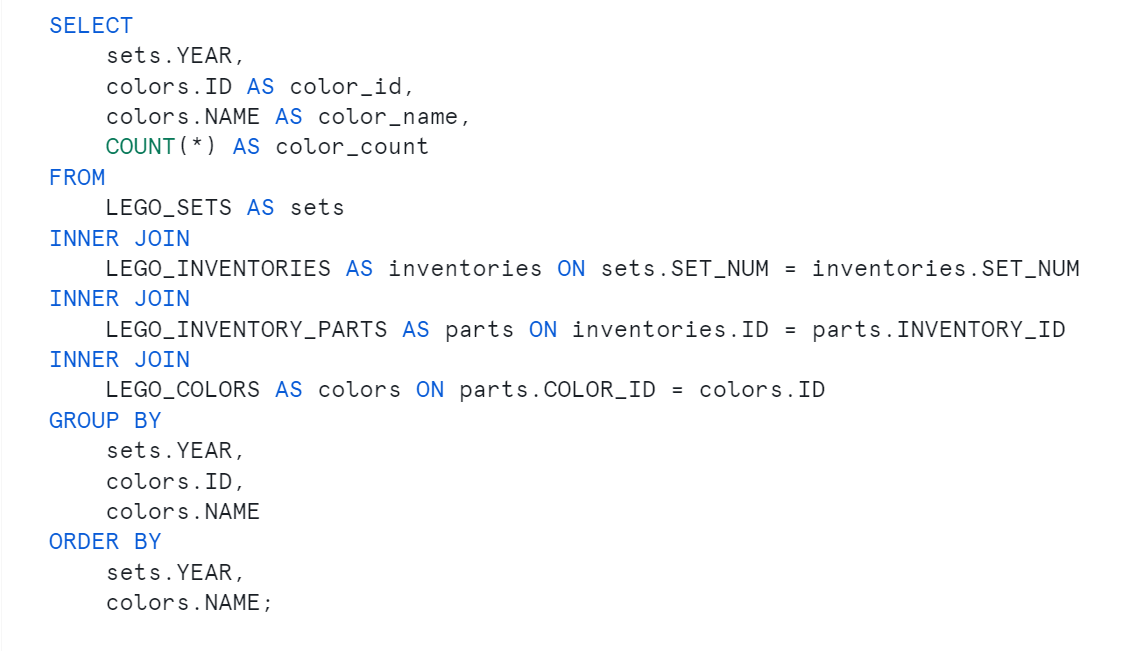
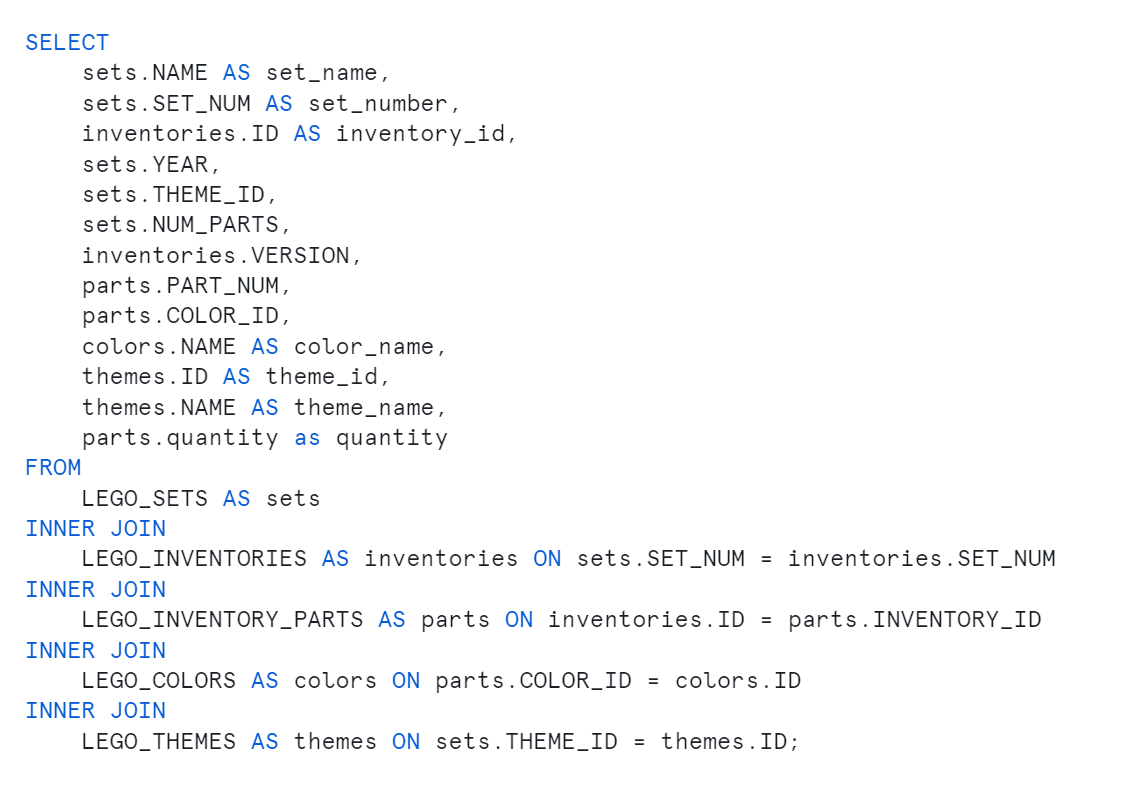
With a clear plan in hand, I began working on the SQL queries, primarily focusing on joining tables. Writing the SQL code was challenging, but having a detailed plan for my desired table and data preparation was extremely helpful. Here are the queries I used:
- Aggregating Total Quantity and Count of Colors by Year:
- Finding the Most Used Color Each Year:
- Counting Colors by Year:
- Detailed Data Extraction for Analysis:
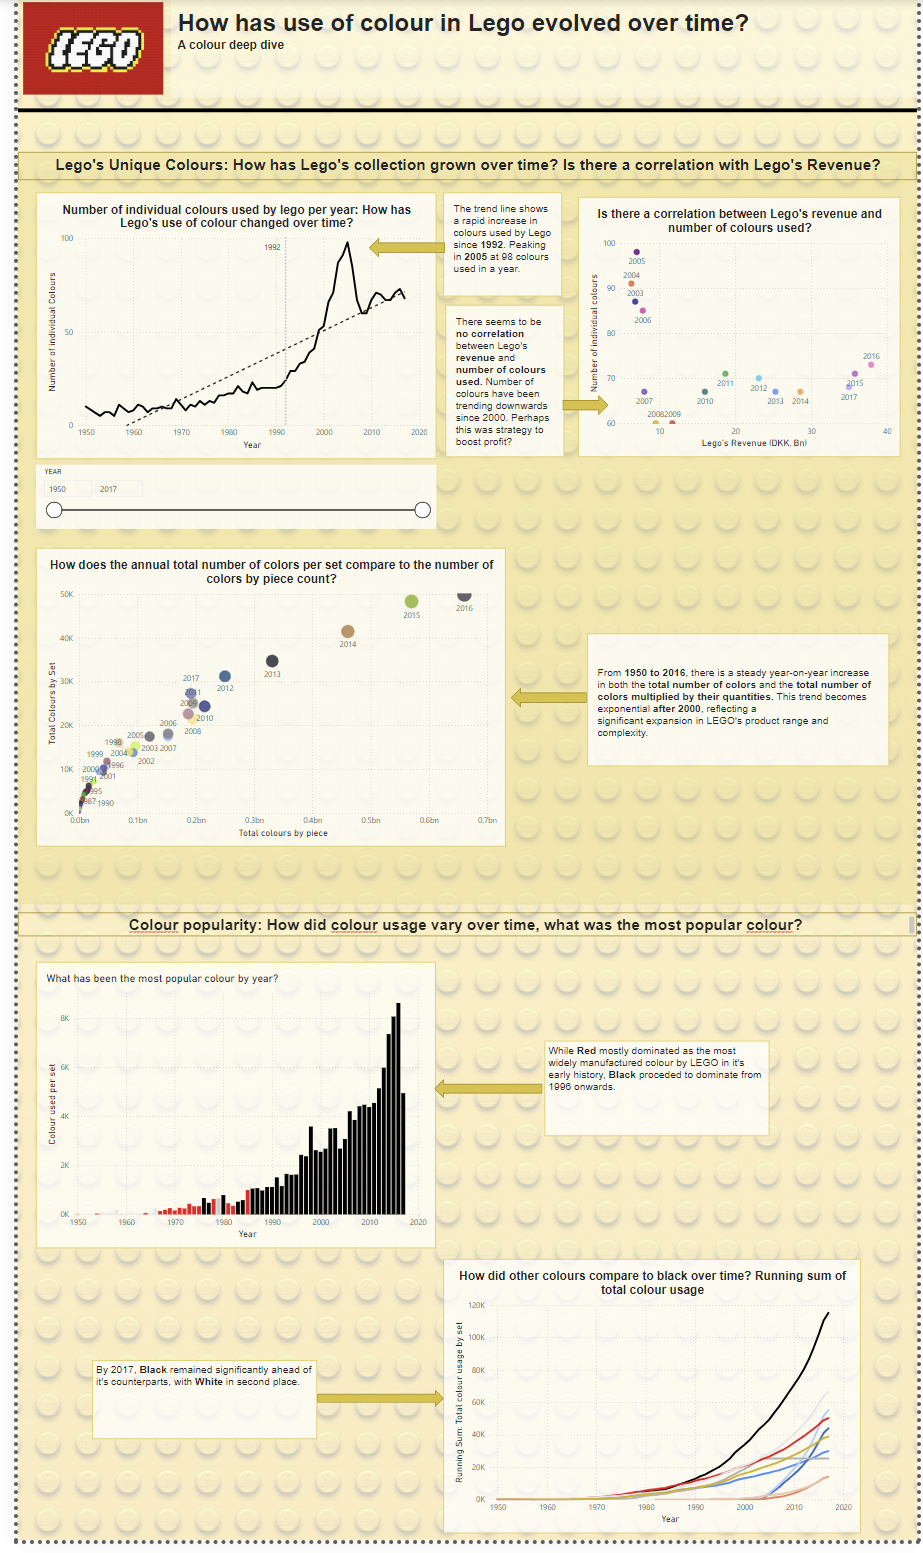
The analysis I wanted to conduct, as the above queries suggest focus primarily on the analysis of colour. I also wanted to do a segment that looked at analysing whether there is a correlation between number of unique colours use and LEGO's revenue. After understanding that I was able to retrieve the dataset. I sketched a plan of what I wanted my dashboard to look like, in addition to the analysis I wanted to conduct:
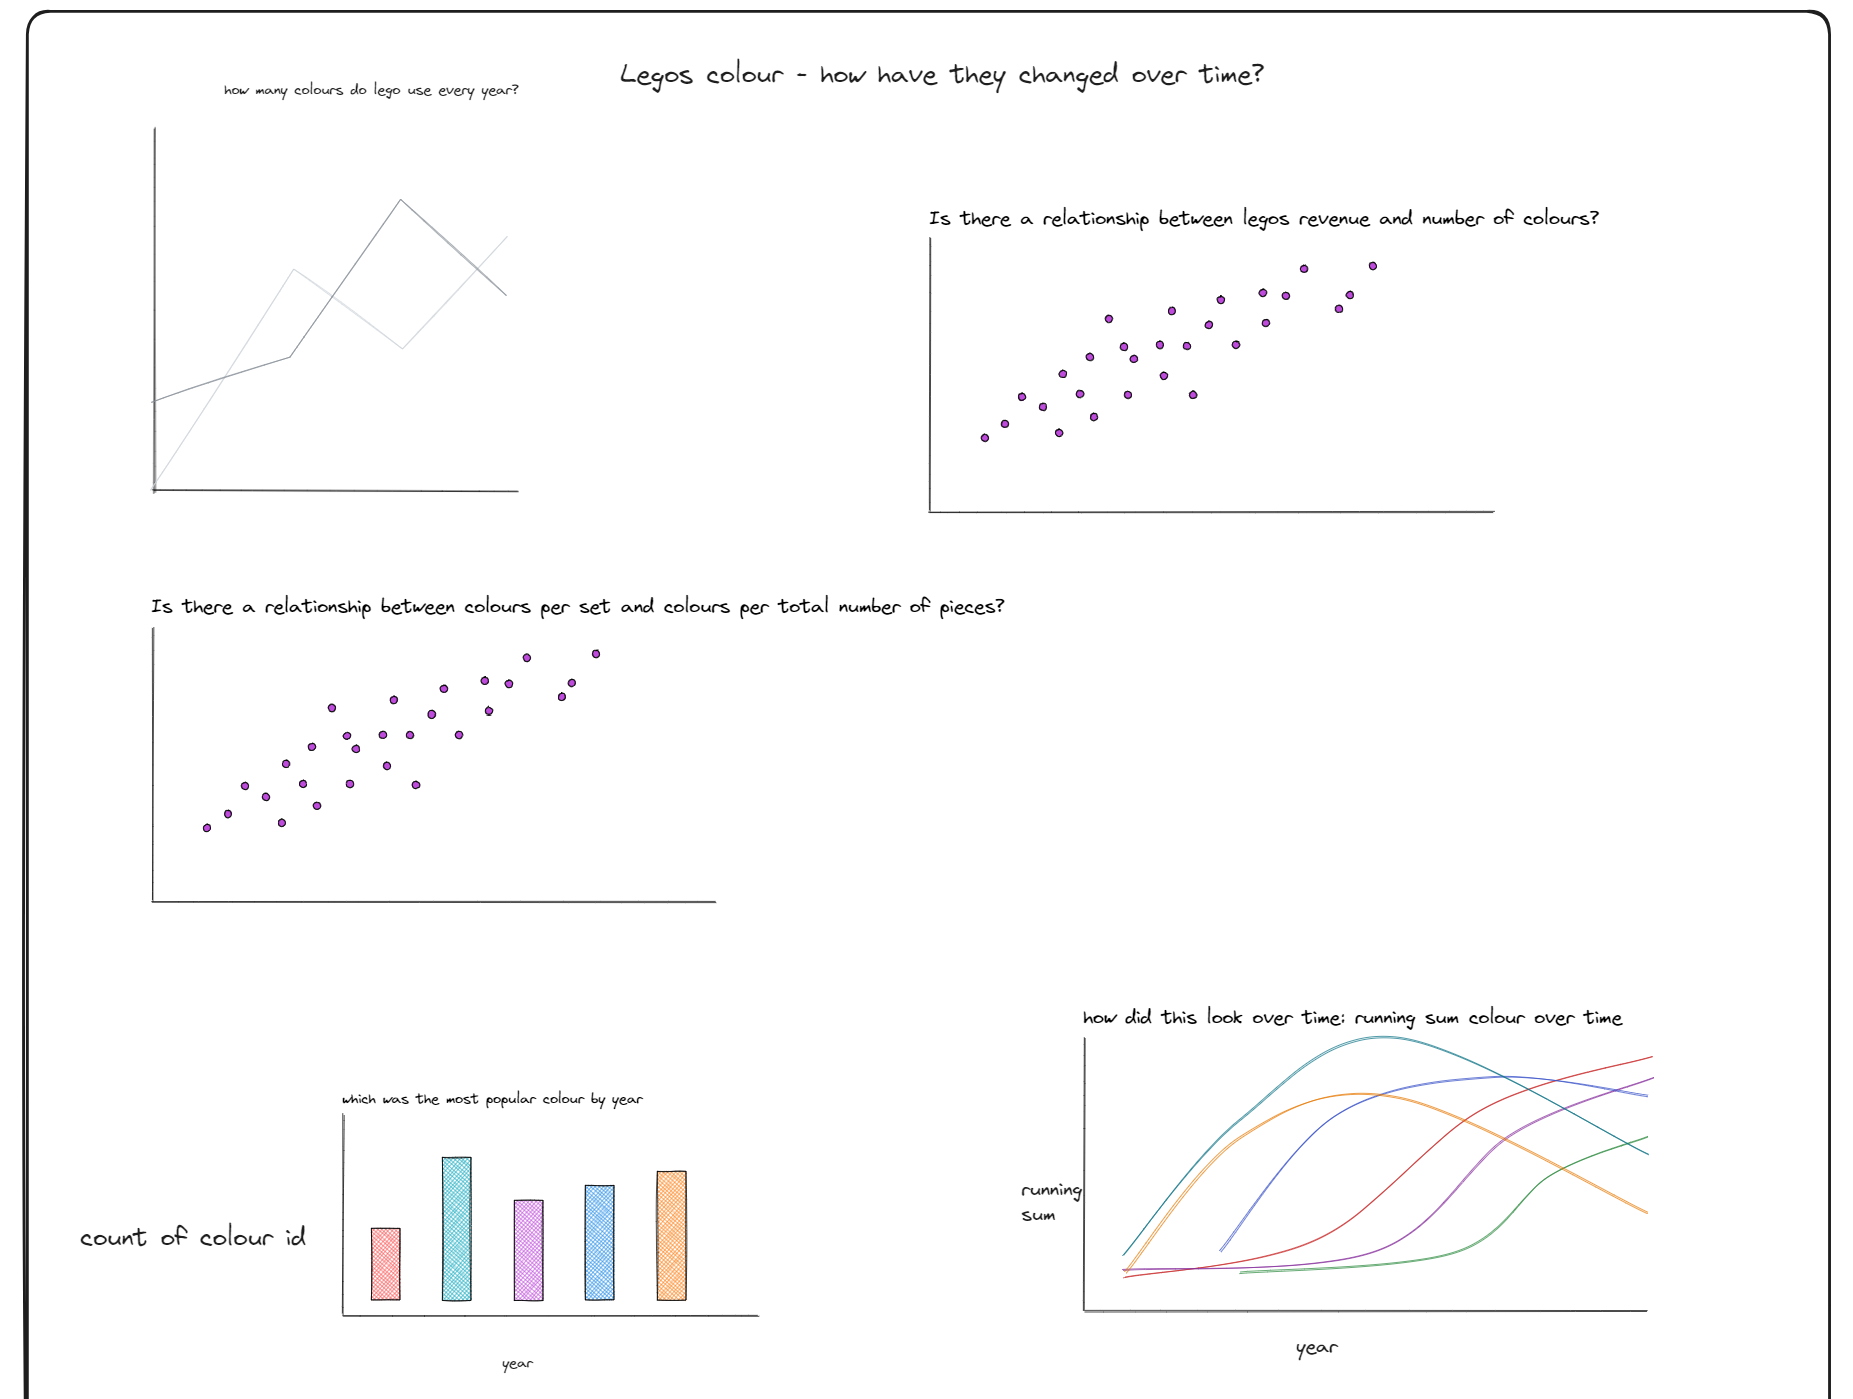
I regret that the plan isn't very detailed. Due to time constraints I spend most of my time on data discovery, and understanding how I would link the 8 tables in snowflake.
Nevertheless, I produced my final product within the time constraints. Although the colour scheme could be improved, I was glad to get it over the line in the short amount of allotted time.