


My very first Tableau dashboard consisted almost entirely of floating objects. Every time I needed to resize a chart or add something new, my entire layout would shift and I’d have to realign everything. What a headache!
Soon after, I learned about the magic of containers, and they completely changed my dashboarding experience. In this post, I wanted to share a few notes on containers that I’ve picked up along the way.
What is a container, and why use them?
A container is a layout object that can hold dashboard elements such as a worksheet, a text box, or even other containers. You can think of them as boxes that define your dashboard’s structure.
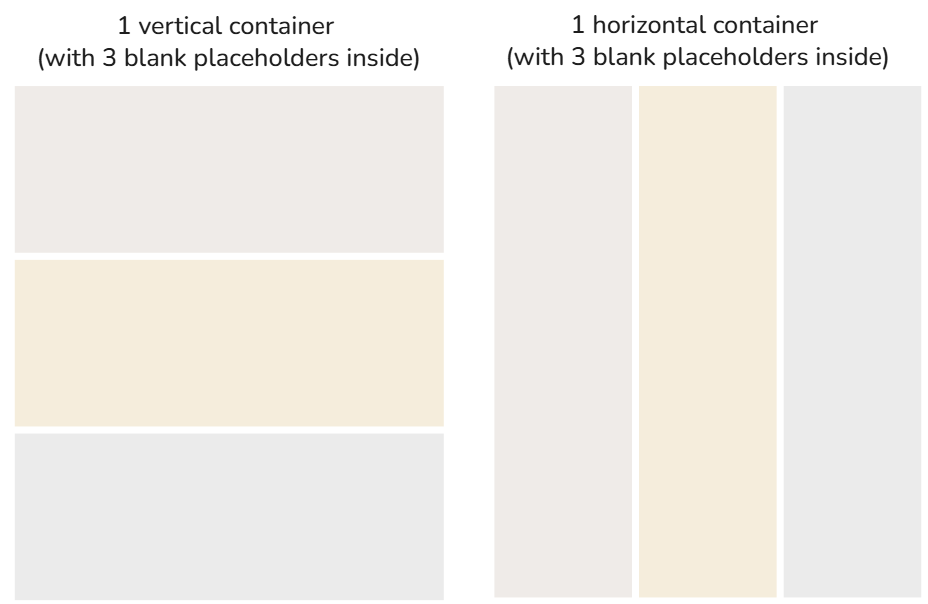
There are two types of containers:
- Vertical containers, which arrange their contents from top to bottom
- Horizontal containers, which arrange their contents from side to side
Containers can also be tiled, meaning that Tableau will snap it into a grid layout, or floating, meaning that they sit on top of the dashboard wherever you place them.
Note that containers can be nested, meaning you can place containers inside other containers (you can even place tiled containers inside a floating container, if you like!). Nesting is key to building complex layouts.
How do you add containers?
First, navigate to the dashboard tab, and then access the objects pane in the bottom left corner.
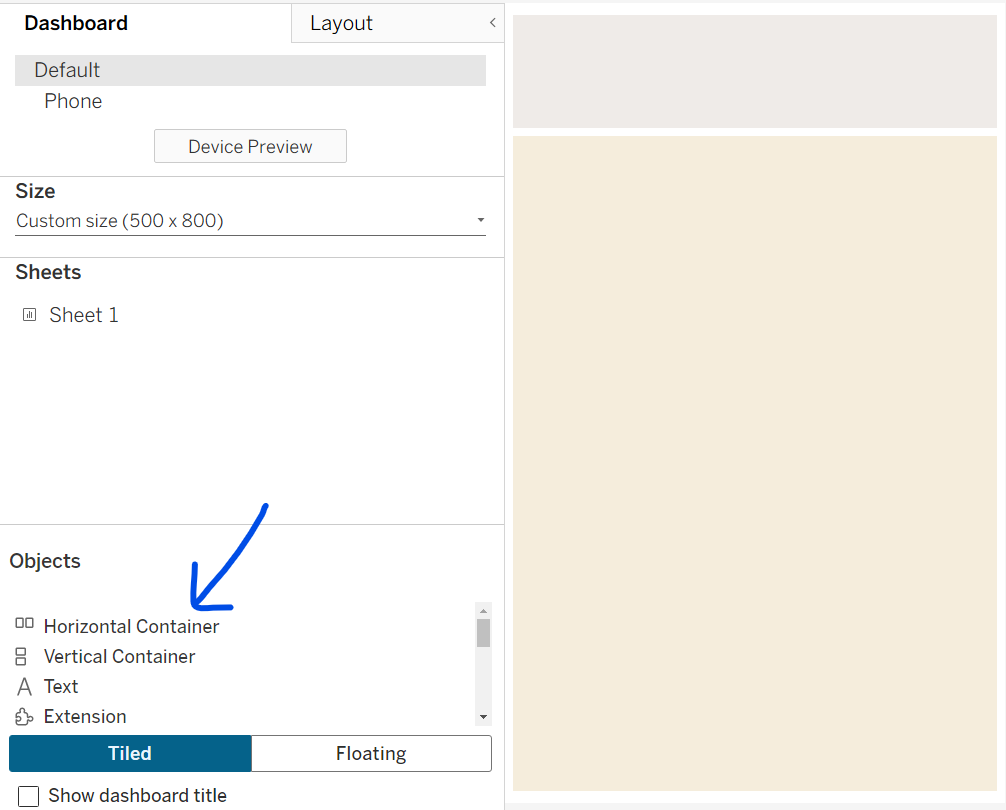
To add a container that snaps into the grid, simply drag it over and drop it when you see the gray shadow appear where you want it to go. To add a floating container, hold Shift when you’re dragging it over to your layout.
Once your containers are on your dashboard, you can use the Shift key and drag to switch them between being floating and inside the grid. If you have an existing floating container that you want to add to the grid, hold Shift, look for the gray shadow, and drop it in. If you have a container that’s already snapped to the grid that you want to make floating, hold Shift and drag it out.
How many containers do I need for my layout?
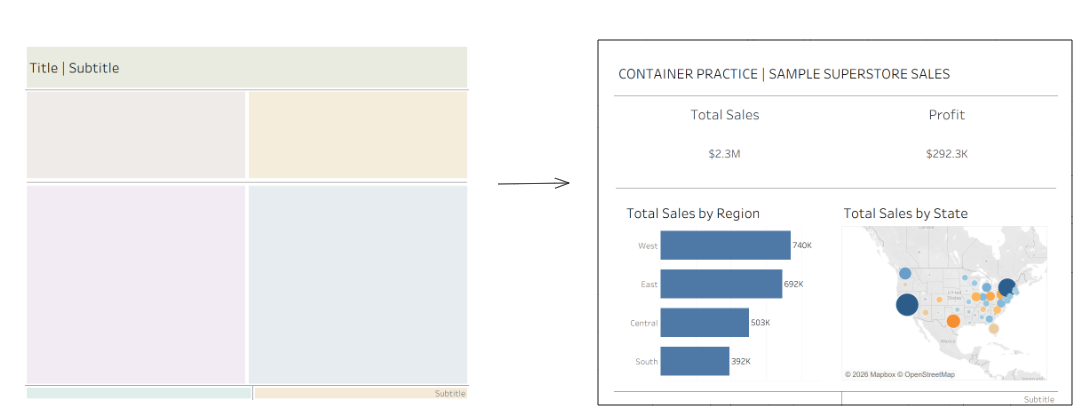
Suppose you are trying to create the layout shown below:
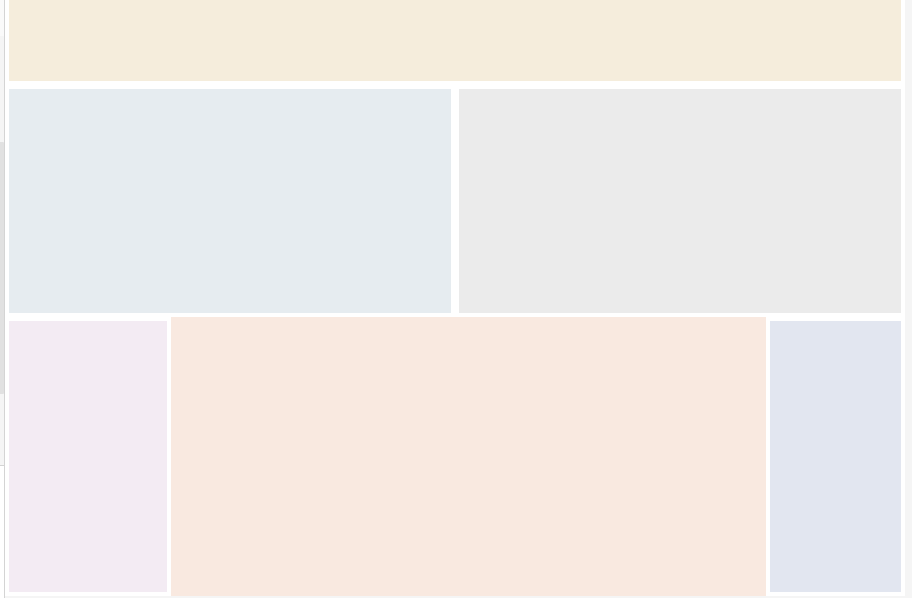
For this layout, you would need four containers: one outer vertical container to define the overall structure (the blue box shown below) and three horizontal containers inside it to create each row (the orange boxes shown below). Then, within each horizontal container you can add blank objects side by side to create placeholders for your charts.
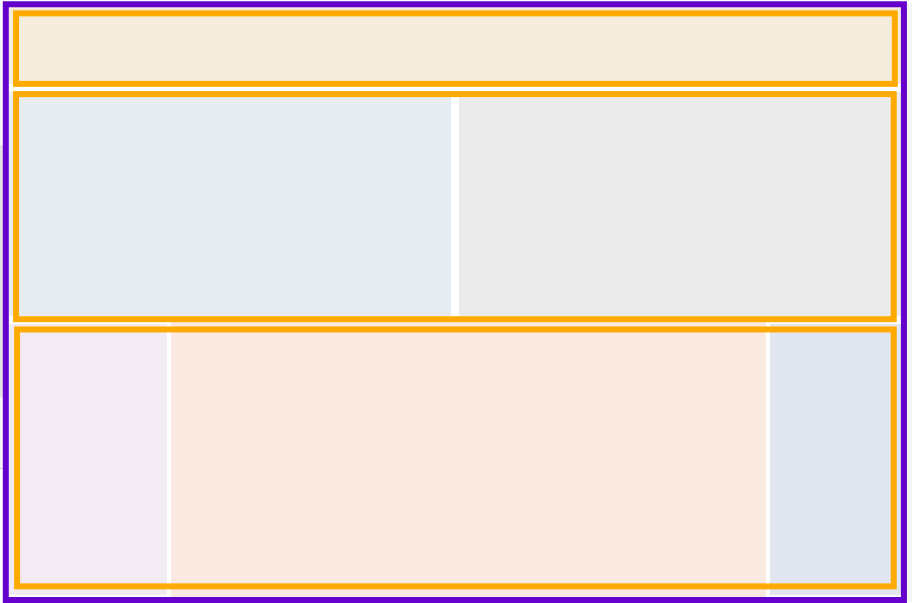
Remember to start with your outermost container, then work inward.
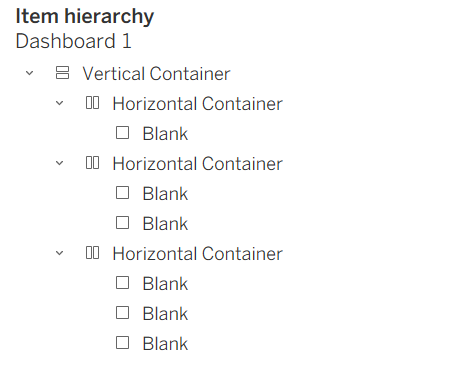
As you are dragging and dropping in the container, ensure that you are keeping track of them in the item hierarchy in the bottom left corner. If you are having issues with a layout behaving unexpectedly, there’s a good chance that your item hierarchy is not organized properly –for example, a common problem I ran into was accidentally nesting boxes that I didn't want to nest.
Here is the item hierarchy for the sample layout I described.
How can I make it easier to manage my containers?
Try creating your layout with colored blanks first. This makes it easier to make sure you're nesting containers properly and keeping them organized in the item hierarchy. Then, once you have everything in position, add in your sheets, and delete the blanks.
That's all for now! In part 2 I'll go over some additional container FAQs.