


KPI period-over-period comparisons in Tableau may seem daunting, but once you get the hang of them they’re quite easy to build out!
For this tutorial I am using the Sample Superstore 2025 dataset. You can download the data here if you would like to follow along.
I will walk through how to create calculations for:
- the sales for a selected year
- comparison to the previous year
- red/green up and down arrows to indicate whether performance improved or declined
Step 1: Create a year calculation
First, create a new calculated field that tells you the year of each Order Date.
Order Date (Year)
DATETRUNC('year', [Order Date])
This function rounds a date down to the start of a specified time period. Since we’re doing this at the yearly level, all dates in 2022 get rounded down to 1/1/2022, all dates in 2023 get rounded down to 1/1/2023, and so on.
Thus, each row in the dataset is assigned one of four year values:
- 1/1/2022
- 1/1/2023
- 1/1/2024
- 1/1/2025
Step 2: Create a date parameter that allows the user to select a year
If you want the list of years to be dynamically updating, then under Allowable Values select “When workbook opens.” Then select the calculated field you just created for Order Date Year.
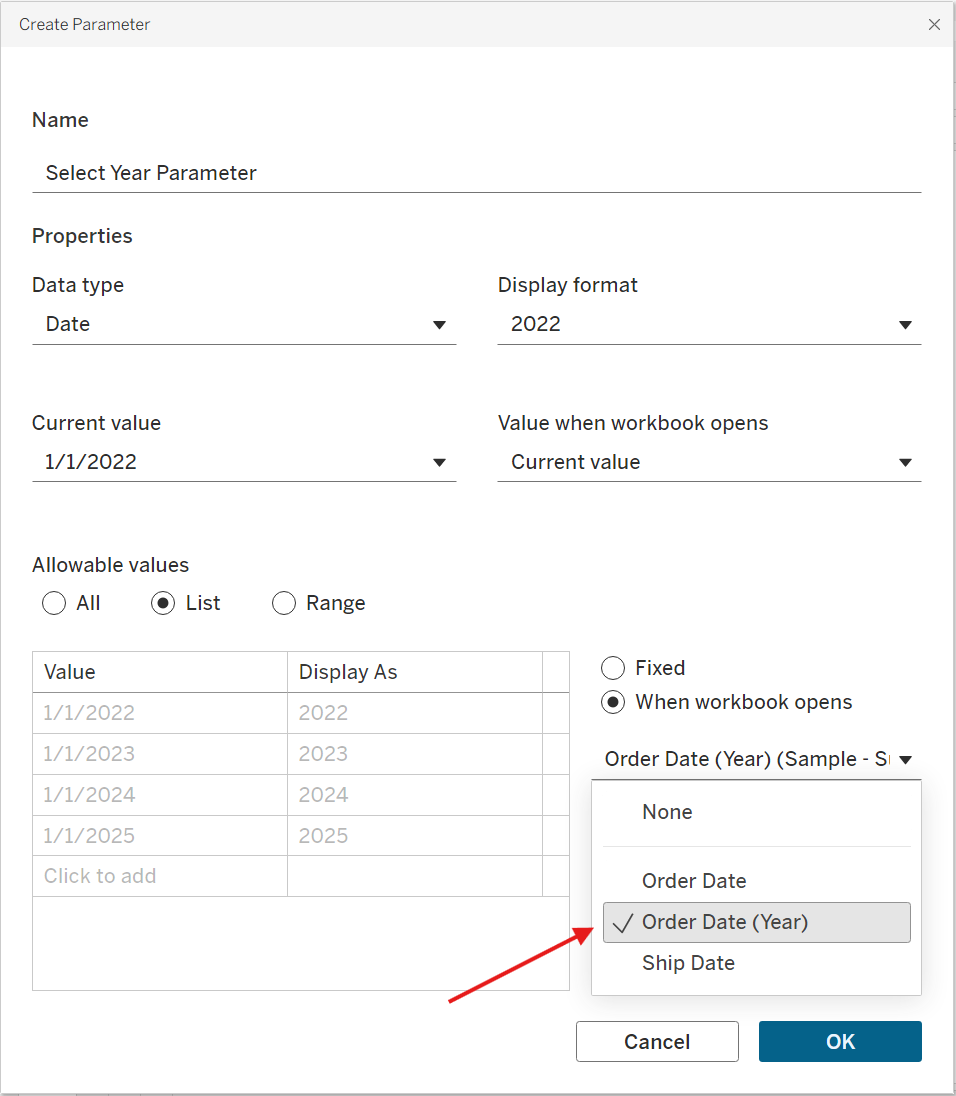
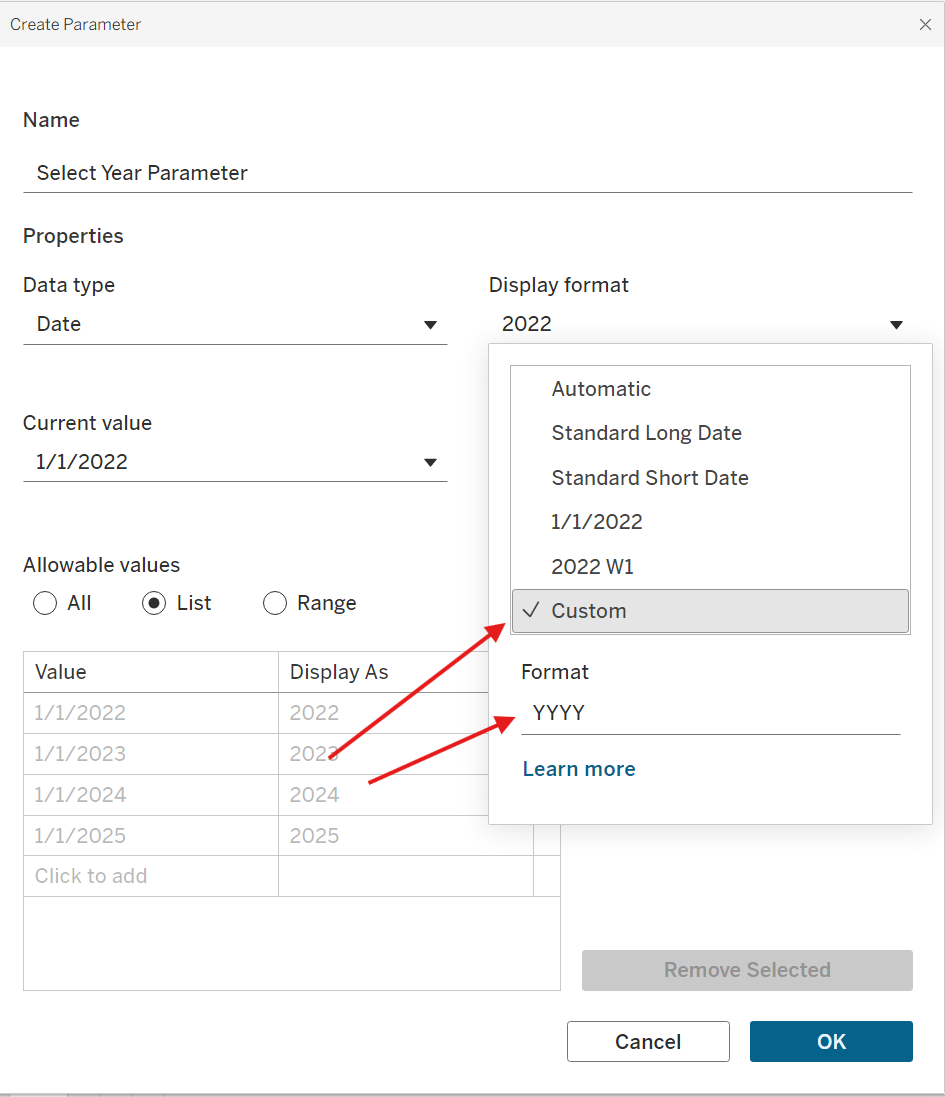
Under Display format, you can also customize the year so that it appears as, say, 2022 rather than the longer version, 1/1/2022.
Select OK, then close out of your parameter. Right click on the parameter in the lefthand side bar, and click “Show Parameter.” The user will use this parameter to select a year.
Step 3: Identify rows in the selected year
At this point, we want to know, for each row within the dataset, whether it belongs to the selected year or not. If it does, we want to include its sales in our total. Otherwise, we want to ignore it.
Create a calculated field.
is Selected Year?
[Select Year Parameter] = DATETRUNC('year', [Order Date])
This calculation checks whether the year of a row’s Order Date matches the year selected in the parameter. If the values match, the calculation returns TRUE.
Step 4: Identify rows in the previous year
Next, create a calculated field to identify rows belonging to the previous year.
is Previous Year?
DATEADD('year', -1, [Select Year Parameter]) = DATETRUNC('year', [Order Date])
This calculation first subtracts one year from the selected year parameter using DATEADD. For example, if the parameter is 2024, the calculation produces 2023.
It then checks whether the row’s Order Date year equals that previous year. If it does, the calculation returns TRUE.
Step 5: Calculate the selected year sales
Create a calculated field that grabs the sales for the selected year.
Selected Year Sales
IF [is Selected Year?] THEN [Sales] END
Note that this calculation does not sum anything yet. Instead, it simply returns the Sales value for rows that belong to the selected year. When you drag this field onto the sheet, Tableau will automatically aggregate it using sum, which will give you the total sales for that selected year.
Step 6: Calculate the previous year sales
Make another calculated field.
Previous Year Sales
IF [is Previous Year?] THEN [Sales] END
This works the same way as the previous calculation, except it returns the Sales values for rows belonging to the previous year.
Step 7: Calculated the year-over-year percentage difference
Create a new calculated field.
Selected Year vs PY Sales %.
(SUM([Selected Year Sales]) - SUM([Previous Year Sales])) / SUM([Previous Year Sales])
Here we do explicitly use SUM because we want to compare the total sales values between the two years.
Format the number as a percentage.
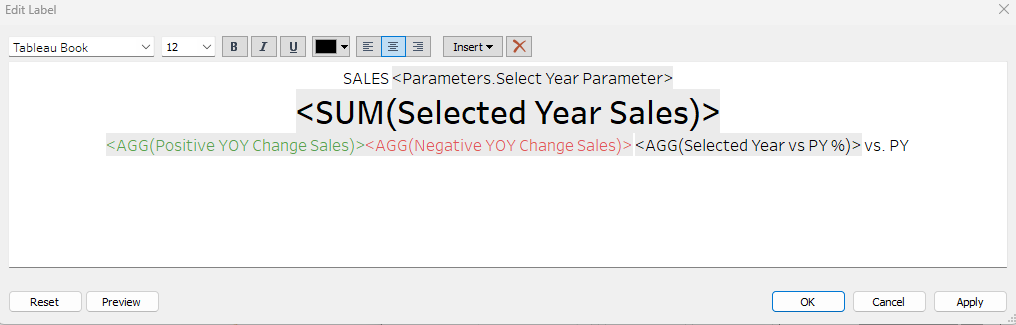
Step 8: Build the KPI
Drag the following fields onto the Text mark:
- Selected Year Sales
- Previous Year Sales
- Selected Year vs PY %
Looking great! Now you have all the main numbers in place. As you toggle through the parameter, you should see all values dynamically update.
Step 9: Add up/down arrows
As a final touch, we can add up and down arrows to indicate whether performance increased or decreased. There are multiple ways to do this.
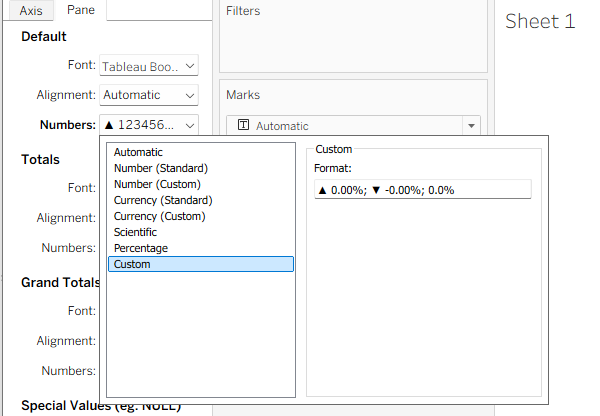
Option 1:
The simplest option is to go into the number formatting pane for your % change calculation, select “Custom,” and input the following:
▲ 0.00%; ▼ -0.00%; 0.0%
(Windows Users: if you hit "Windows" then "." you will bring up the emojis and more window. Navigate to the "symbols" section where you will find up and down arrows. Max Users – apologies, I am Mac illiterate.)
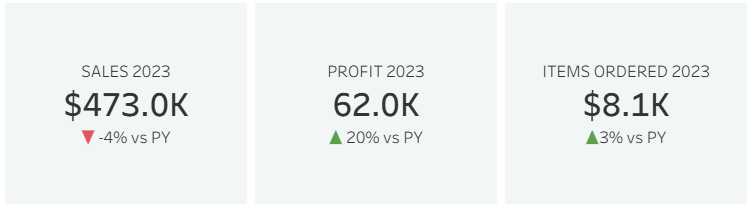
This creates a KPI that looks like this:

Option 2
If you want to go the extra mile and color the arrows red and green, you can create two calculated fields.
Positive YOY Change Sales
If [Selected Year Sales] > 0 THEN "▲" END
Negative YOY Change Sales
If [Selected Year vs PY %] < 0 THEN "▼" END
Add both fields to the Text Marks Card, and color them accordingly (green for the up arrow, red for the down arrow)
When sales are positive, you will only see the green up arrow. When sales are negative, you will only see the red down arrow.
This should create a KPI that looks like this:
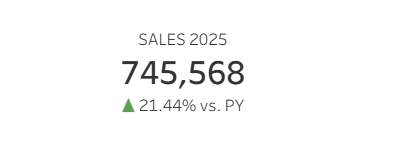
There you go! You now have a dynamic year-over-year KPI in Tableau that updates based on the year the user selects.